Question
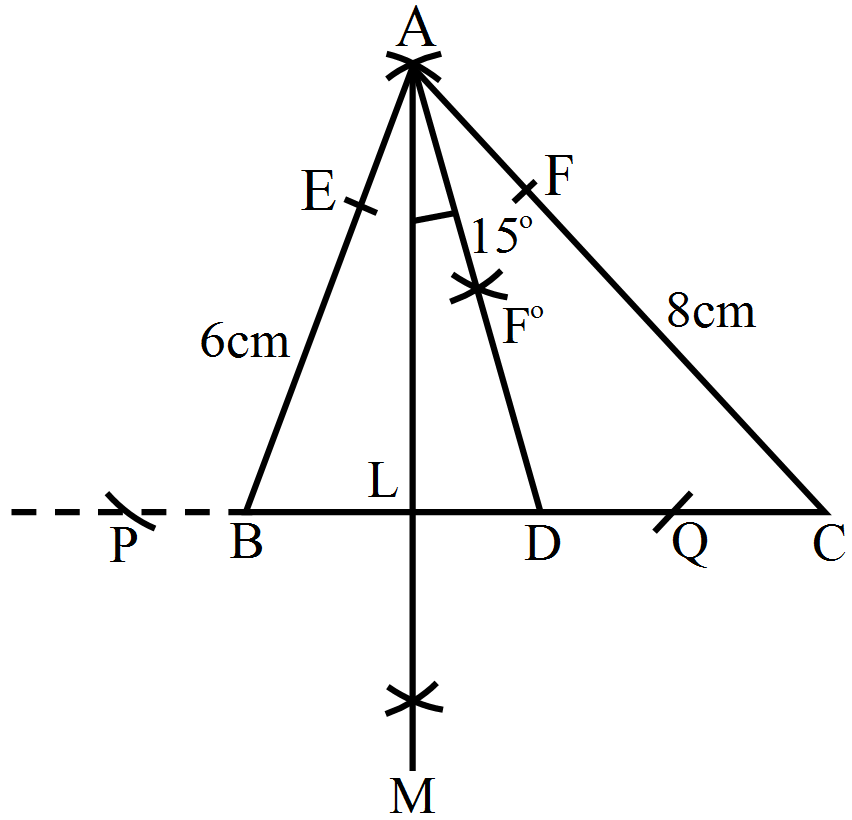
Draw a $\triangle\text{ABC}$ with AB = 6cm, BC = 7cm and CA = 8cm. Using ruler and compass alone, draw (i) the bisector AD of $\angle\text{A}$ and (ii) perpendicular AL from A on BC. Measure LAD.

Answer


Steps of construction:
Step I: Draw a line segment BC of length 7cm.
Step II: With centre B, draw an arc of radius 6cm.
Step III: With centre C, draw an arc of radius 8cm intersecting the previously drawn arc at A.
Step IV: Join AC and BC to get the required triangle.
Angle bisector steps:
Step I: From A, cut arcs of equal radius intersecting AB and AC at E and F respectively.
Step II: From E and F, cut arcs of equal radius intersecting at point H.
Step III: Join AH and extend to produce the angle bisector of angle A, meeting line BC at D.

Need a full question paper?

Generate a complete, print-ready paper with questions like this in minutes — across 16+ boards, with answer keys.

Start Generating Free

Similar questions

Arrange the following fractions in ascending order:
$\frac{3}{8},\frac{5}{6},\frac{6}{8},\frac{2}{4},\frac{1}{3}$
A dice was cast 40 times and each score noted is given below. Draw up a frequency table for this data.
3, 2, 5, 6, 4, 2, 3, 1, 6, 6, 2, 3, 5, 3, 5, 3, 4, 2, 4, 5, 4, 2, 6, 3, 3, 2, 4, 3, 3, 4, 1, 4, 3, 3, 2, 2, 5, 3, 3, 4.
Draw $\triangle\text{DEF}$ such that DE= DF= 4cm and EF = 6cm. Measure $\angle\text{E}$ and $\angle\text{F}.$
Daily wages of 45 workers in a factory are given below:
Daily wages (in Rs) 300 375 450 525 600
Number of workers 6 8 9 12 10
Find the median and the mean.
Using empirical formula, calculate its mode.
Draw triangle with the measures given. In ∆NTS, m∠T = 40°, l(NT) = l(TS) = 5 cm.
Draw $\triangle\text{ABC}$ in which AB = 5.5cm. BC = 6cm and CA = 7cm. Also, draw perpendicular bisector of side BC.
In the given figure, AB || CD, $\angle\text{ABE}=120^\circ,\ \angle\text{ECD}=100^\circ$ and $\angle\text{BEC}=\text{x}^\circ.$ Find the value of x.
In a survey or 85 families of a colony, the number of members in each family was recorded, and the data has been represented by the following bar graph:

Read the bar graph carefully and answer the questions given below:
  1. What information does the bar graph give?
  2. How many families have 3 members?
  3. How many people live alone?
  4. Which type of family is the most common? How many members are there in each family of this kind?
The height of 30 children in a class is given in centimeters. Draw up a frequency table of this data.
131, 135, 140, 138, 132, 133, 135, 133, 134, 135, 132, 133, 140, 139, 132, 131, 134, 133, 140, 140, 139, 136, 137, 136, 139, 137, 133, 134, 131, 140
Find the products given below and case verify the result for a = 1, b = 2 and c = 3.
$\Big(\frac{4}{9} \text{abc}^3\Big)\times \Big(\frac{-27}{5} \text{a}^3 \text{b}^2\Big)\times(-8 \text{b}^3 \text{c})$