Question
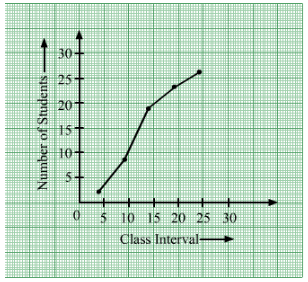
Draw an ogive to represent the following frequency distribution:
Class-interval
0-4
5-9
10-14
15-19
20-24
No. of students
2
6
10
5
3

Answer

Firstly, prepare the cumulative frequency table.
Class interval
No. of students
Less than
Cumulative frequency
Suitable points
0-4
2
4
2
(4,2)
5-9
6
9
8
(9,8)
10-14
10
14
18
(14,18)
15-19
5
19
23
(19,23)
20-24
3
24
26
(24,26)
Now, plot the less than ogive using the suitable points.

Need a full question paper?

Generate a complete, print-ready paper with questions like this in minutes — across 16+ boards, with answer keys.

Start Generating Free