Question 12 Marks
The monthly profits (in Rs.) of 100 shops are distributed as follows:
Draw the frequency polygor it.
| Profits per shop | 0-50 | 50-100 | 100-150 | 150-200 | 200-250 | 250-300 |
| No. of shops | 12 | 18 | 27 | 20 | 17 | 6 |
Answer
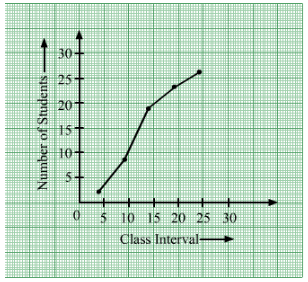
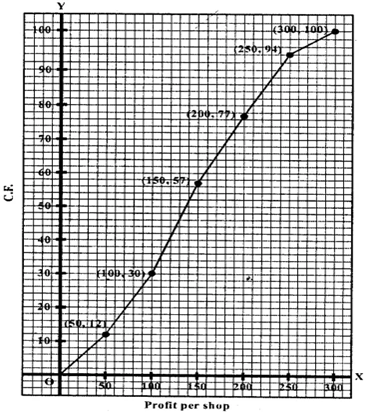 Represent profits per shop along x-axis and no. of shop (c.f.) along y-axis.
Plot the points (50, 12), (100, 30), (150, 57), (200, 77), (250, 94) and (300, 100) on the graph and join them with ruler. This is the cumulative polygon as shown.
View full question & answer→|
Profits per shop
|
No. of shops (f)
|
c.f.
|
|
0-50
|
12
|
12
|
|
50-100
|
18
|
30
|
|
100-150
|
27
|
57
|
|
150-200
|
20
|
77
|
|
200-250
|
17
|
94
|
|
250-300
|
6
|
100
|
Represent profits per shop along x-axis and no. of shop (c.f.) along y-axis.Plot the points (50, 12), (100, 30), (150, 57), (200, 77), (250, 94) and (300, 100) on the graph and join them with ruler. This is the cumulative polygon as shown.