Question
Draw Average Variable Cost (AVC), Average Total Cost (ATC) and Marginal Cost (MC) curves in a single diagram. State the relation between MC curve and AVC & ATC curves.
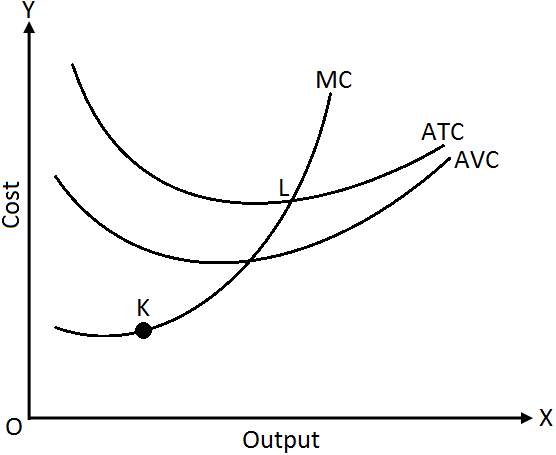
Relationship among MC, AVC & AC:
When,
MC < ATC or AVC, ATC or AVC falls
MC = ATC or AVC, ATC or AVC constant
MC > ATC or AVC, ATC or AVC rises.
Generate a complete, print-ready paper with questions like this in minutes — across 16+ boards, with answer keys.
| 1. | GNP at factor cost. | 95,000 |
| 2. | Indirect Taxes. | 14,000 |
| 3. | NDP at market prices. | 1,00,422 |
| 4. | NNP at market prices. | 1,000,000 |
| 5. | GNP at market prices. | 1,07,000 |
| S. No. | | (₹ in lakhs) |
| (i) | Sales by firm A. | 300 |
| (ii) | Purchases from firm B by firm A. | 120 |
| (iii) | Purchases from firm A by firm B. | 180 |
| (iv) | Sales by firm B. | 600 |
| (v) | Closing stock of firm A. | 60 |
| (vi) | Closing stock of firm B. | 105 |
| (vii) | Opening stock of firm A. | 75 |
| (viii) | Opening stock of firm B. | 135 |
| (ix) | Indirect taxes by both firms. | 90 |
OR
Why is the demand curve of the commodity negatively sloped?
Output (Units) | Total Revenue (₹) | Total Cost (₹) |
| 1 | 7 | 8 |
| 2 | 14 | 15 |
| 3 | 21 | 21 |
| 4 | 28 | 28 |
| 5 | 35 | 36 |
| Output (units) | Price (₹) | Total Cost (₹) |
| 1 | 10 | 13 |
| 2 | 10 | 22 |
| 3 | 10 | 30 |
| 4 | 10 | 38 |
| 5 | 10 | 47 |
| 6 | 10 | 57 |
| 7 | 10 | 71 |
| Q | SMC |
| 0 1 2 3 4 5 6 | - 500 300 200 300 500 800 |