Question
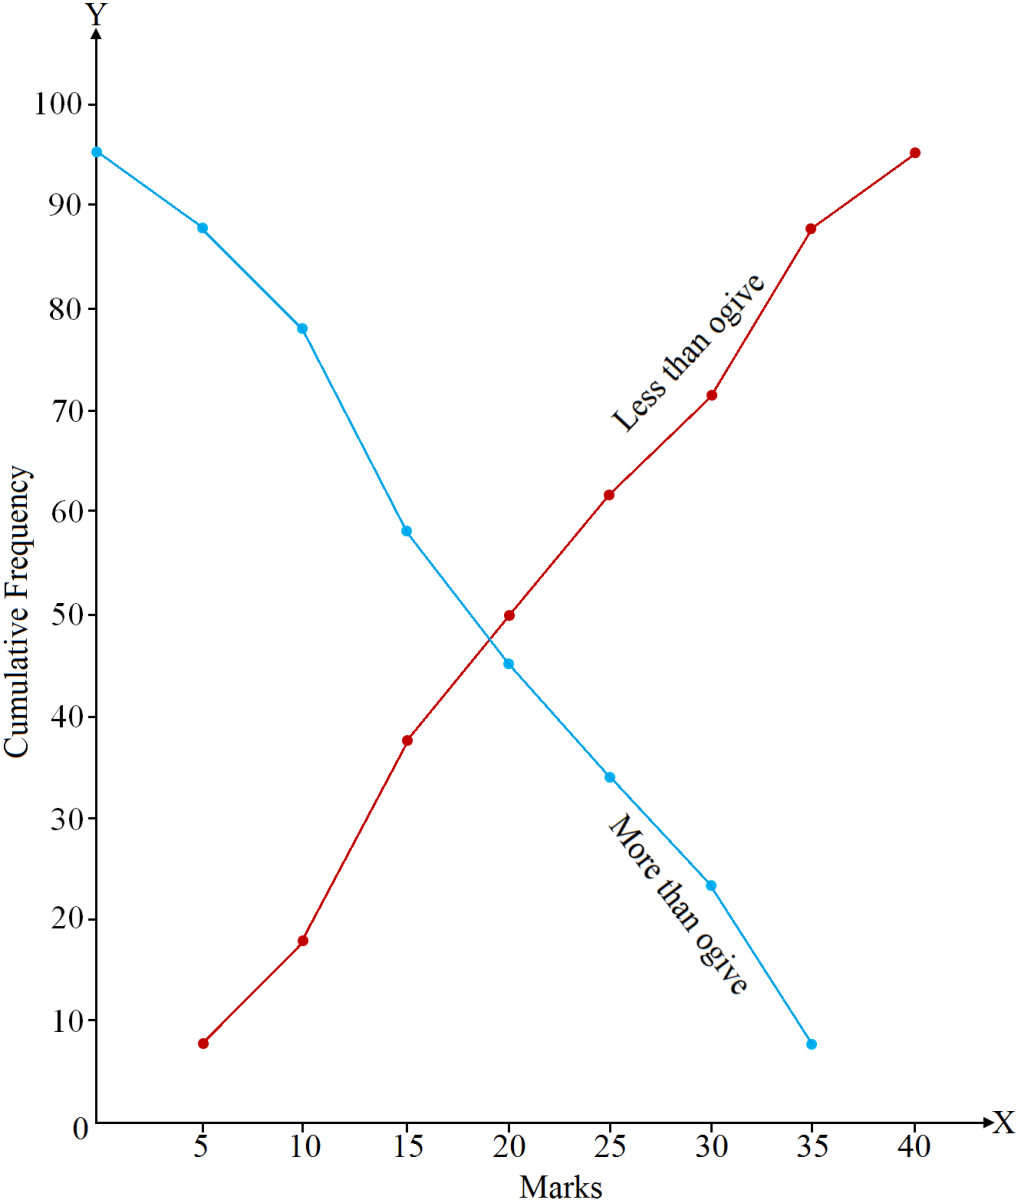
Draw less than and more than ogive (cumulative frequency curve) using the following data:
Marks
0-5
5-10
10-15
15-20
20-25
25-30
30-35
35-40
No. of Students
7
10
20
13
12
10
15
8

Answer

Marks
c.f. (less than)
Less than 5
7
Less than 10
17
Less than 15
37
Less than 20
50
Less than 25
62
Less than 30
72
Less than 35
87
Less than 40
95
 
Marks
c.f. (more than)
More than 0
95
More than 5
88
More than 10
78
More than 15
58
More than 20
45
More than 25
33
More than 30
23
More than 35
8

Need a full question paper?

Generate a complete, print-ready paper with questions like this in minutes — across 16+ boards, with answer keys.

Start Generating Free

Similar questions

Find out mean deviation of the following data.
Items: 5 10 15 20 25 30 35 40
Frequency: 8 16 18 22 14 9 6 7
Explain the causes for a leftward shift of demand curve.
Calculate the coefficient of rank correlation from the following data:
X
75
88
95
70
60
80
81
50
Y
120
134
150
115
110
140
142
100
What do you mean by loss of information in organized data?
Define market demand. Explain the factors that affect it.
Write any four methods of collecting primary data Explain any one method along with its two merits and two demerits.
Following table gives the distribution of companies according to the size of capital. Using step deviation method, find out the mean size of the capital of a company.
Capital (₹ in lakh)
Less than 5
Less than 10
Less than 15
Less than 20
Less than 25
Less than 30
Number of Companies
20
27
29
38
48
53
Hint: In the above problem, cumulative frequenices are given, we first find the simple frequencies and thereafter we will calculate arithmetic mean.
Differentiate between systematic and stratified sampling with examples.
Find the standard deviation from the following data:
Marks: $0-10$ $10-20$ $20-30$ $30-40$ $40-50$
No. of Students: $10$ $15$ $10$ $10$ $5$
Which type of diagram is recommended to present:
  1. Components of family expenditure.
  2. Balance of payments in an economy.
  3. Profits or losses of a company.
  4. Production of Rice in Punjab in five years.
  5. Composition of students in a school by their marks in four years.
  6. Birth rate and death rate of five countries.