Question
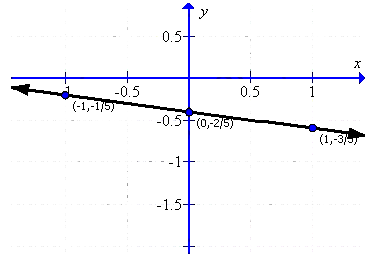
Draw the graph for the linear equation given below$:x + 5y + 2 = 0$
| $x$ | $- 1$ | $0$ | $1$ |
| $y$ | $-\frac{1}{5}$ | $-\frac{2}{5}$ | $-\frac{3}{5}$ |
Generate a complete, print-ready paper with questions like this in minutes — across 16+ boards, with answer keys.