Question 13 Marks
Draw the line $2x - 3y - 18 = 0$ on a graph paper. From the graph paper, read the $y-$intercept of the line.
AnswerGiven line is
$2x – 3y – 18 = 0$
The graph of the given line is shown below.
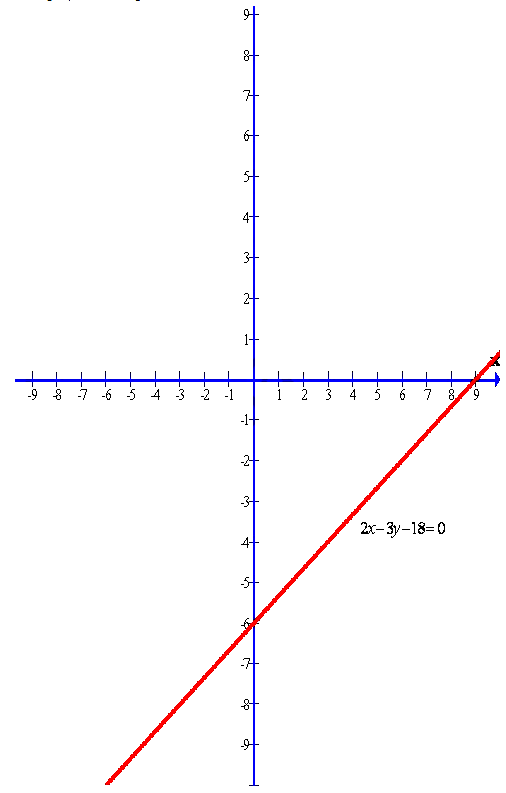
Clearly from the graph we can find the $y-$intercept.
The required $y-$intercept is$ -6.$ View full question & answer→Question 23 Marks
Draw the line $3x + 4y = 12$ on a graph paper. From the graph paper, read the $y-$intercept of the line.
AnswerGiven line is $3x + 4y = 12$
The graph of the given line is shown below.
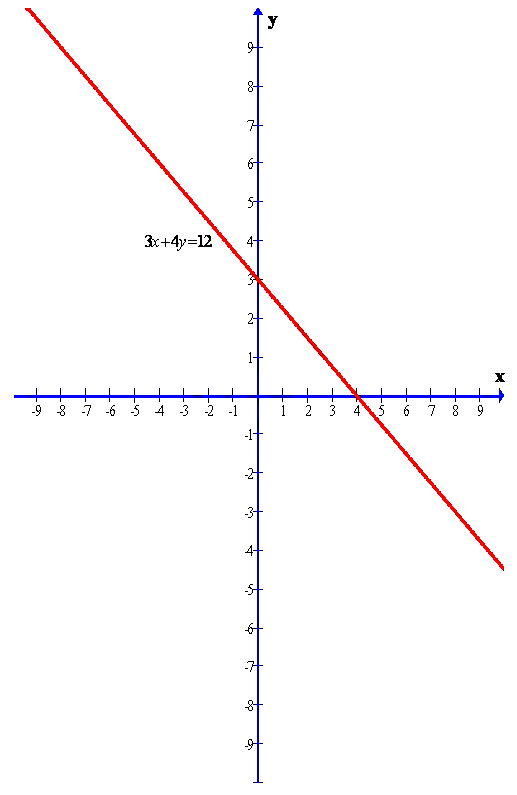
Clearly from the graph we can find the $y-$intercept.
The required $y-$intercept is $3.$ View full question & answer→Question 33 Marks
For the equation given below, find the slope and the $y-i$ntercept$:4y + 9 = 0$
AnswerEquation of any straight line in the form $y = mx + c,$
where slope$ = m($co$-$efficient of $x)$ and $y-$intercept $= c($constant term$)$
$4y + 9 = 0$
$4y = 0 · x - 9 y$
$=\frac{0}{4} x-\frac{9}{4}$
$y=0 \cdot x+$$\left(-\frac{9}{4}\right)$
Therefore,
slope $=$ co$-$efficient of $x = 0$
$y-$intercept $=$ constant term $= -\frac{9}{4}$
View full question & answer→Question 43 Marks
For the equation given below, find the slope and the $y-$intercept$:3y = 7$
AnswerEquation of any straight line in the form $y = mx + c,$ where slope $= m($co$-$efficient of $x)$ and $y-$intercept $= c($constant term$)$
$3y = 7$
$3y = 0 · x + 7$
$y =\frac{0}{7} x+\frac{7}{3}$
$y=0 \cdot x+\frac{7}{3}$
Therefore,
slope $=$ co$-$efficient of $x = 0$
$y-$intercept $=$ constant term $=\frac{7}{3}$.
View full question & answer→Question 53 Marks
For the equation given below, find the slope and the $y-$intercept:$x= 5y - 4$
AnswerEquation of any straight line in the form $y = mx + c,$
where slope $= m ($co$-$efficient of $x)$ and $y-$ intercept $= c($constant term$)$
$x= 5y - 4$
$5y = x + 4$
$y=\frac{x+4}{5}$
$y=\frac{1}{5} x+\frac{4}{5}$
Therefore,
slope $=$ co$-$efficient of $x=\frac{1}{5}$
$ y-$intercept $=$constant term$=\frac{4}{5}$
View full question & answer→Question 63 Marks
For the equation given below, find the slope and the $y-$intercept:$5x = 4y + 7$
AnswerEquation of any straight line in the form $y = mx + c,$
where slope $= m ($co$-$efficient of $x)$ and $y-$intercept $= c($constant term$)$
$5x = 4y + 7$
$5x = 4y + 7$
$4y = 5x - 7$
$y=\frac{5 x-7}{4}$
$y=\frac{5}{4} x+\left(-\frac{7}{4}\right)$
Therefore,
slope $-$ co$-$efficient of $x=\frac{5}{4}$
$y$-intercept $=$ constant term $=-\frac{7}{4}$
View full question & answer→Question 73 Marks
For the equation given below, find the slope and the $y-$intercept$:x + 3y + 5 = 0$
AnswerEquation of any straight line in the form $y = mx + c,$
where slope $= m($co$-$efficient of $x)$ and $y-$intercept $= c($constant term$)$
$x + 3y + 5 = 0$
$x + 3y + 5 = 0$
$3y = - x - 5$
$y = \frac{-x-5}{3} y$
$=\frac{-1}{3} x+\left(-\frac{5}{3}\right)$
Therefore,
slope $=$ co$-$efficient of x $=-\frac{1}{3}$
$y-$intercept $=$ constant term $=-\frac{5}{3}$.
View full question & answer→Question 83 Marks
For the linear equation, given above, draw the graph and then use the graph drawn $($in the following case$)$ to find the area of a triangle enclosed by the graph and the co$-$ordinates axes$:7 - 3 (1 - y) = - 5 + 2x.$
AnswerFirst draw the graph as follows:
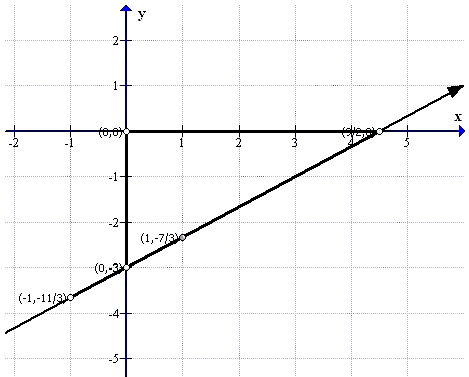
This is a right triangle.
Thus the area of the triangle will be:
$A=\frac{1}{2} \times$ base $\times$ altitude
$=\frac{1}{2} \times \frac{9}{2} \times 3$
=$\frac{27}{4}$
$=6.75\ sq.units$ View full question & answer→Question 93 Marks
For the linear equation, given above, draw the graph and then use the graph drawn $($in the following case$)$ to find the area of a triangle enclosed by the graph and the co$-$ordinates axes$:3x - (5 - y) = 7$
AnswerFirst draw the graph as follows:
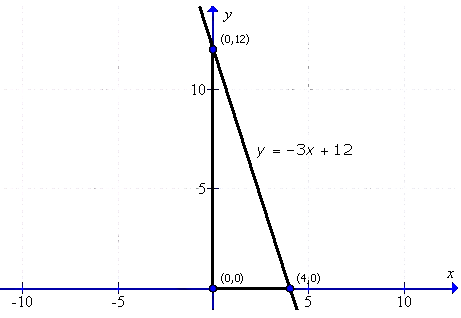
This is an right triangle. Thus the area of the triangle will be:
$= \frac{1}{2} \times$ base $\times$ altitude
$=\frac{1}{2} \times 4 \times 12=24 \ sq.units$ View full question & answer→Question 103 Marks
Draw the graph for the equation given below$:2x - 5y = 10$
AnswerTo draw the graph of $2x - 5y = 10$ follows the steps:
First, prepare a table as below:
| $X$ |
$-1$ |
$0$ |
$1$ |
| $Y$ |
$-\frac{12}{5}$ |
$-2$ |
$-\frac{8}{5}$ |
Now sketch the graph as shown: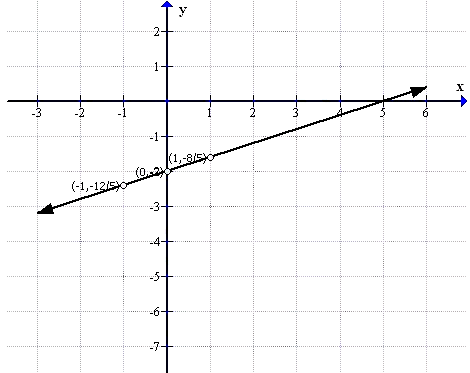
From the graph it can verify that the line intersects the $x-$axis at $(5,0)$ and $y$ at $(0,-2).$ View full question & answer→Question 113 Marks
Draw the graph for the equation given below$:3x + 2y = 6$
AnswerTo draw the graph of $3x + 2y = 6$ follows the steps:
First prepare a table as below:
| $X$ |
$- 2$ |
$0$ |
$2$ |
| $Y$ |
$6$ |
$3$ |
$0$ |
Now sketch the graph as shown:
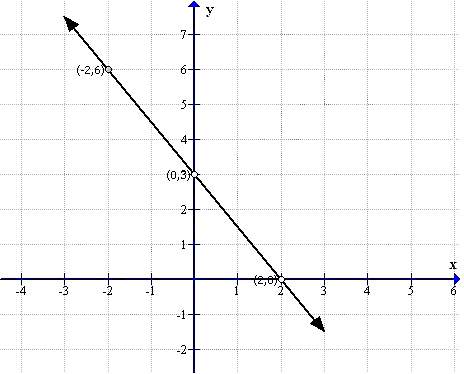
From the graph it can verify that the line intersects the $x-$axis at $(2,$0) and $y$ at $(0,3).$ View full question & answer→Question 123 Marks
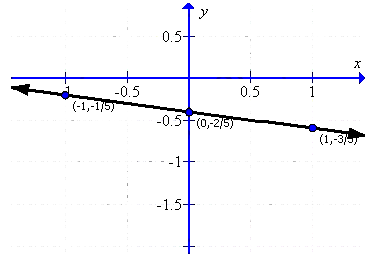
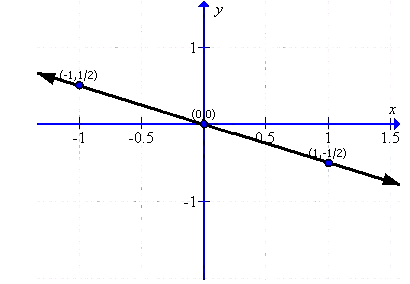
Draw the graph for the linear equation given below$:x + 5y + 2 = 0$
AnswerFirst prepare a table as follows:
| $x$ |
$- 1$ |
$0$ |
$1$ |
| $y$ |
$-\frac{1}{5}$ |
$-\frac{2}{5}$ |
$-\frac{3}{5}$ |
Thus the graph can be drawn as follows:
View full question & answer→Question 133 Marks
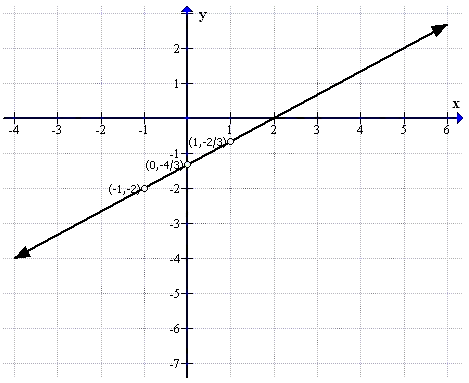
Draw the graph for the linear equation given below$:2x - 3y = 4$
AnswerFirst prepare a table as follows:
| $x$ |
$- 1$ |
$0$ |
$1$ |
| $y$ |
$- 2$ |
$-\frac{4}{3}$ |
$-\frac{2}{3}$ |
Thus the graph can be drawn as follows
:
View full question & answer→Question 143 Marks
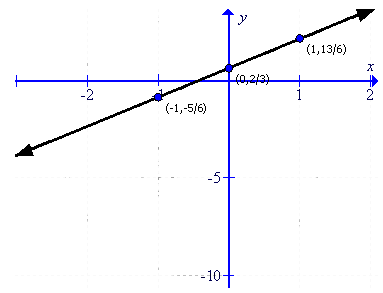
Draw the graph for the each linear equation given below:$y=\frac{3 x}{2}+\frac{2}{3}$
AnswerFirst prepare a table as follows:
| $x$ |
$-1$ |
$0$ |
$1$ |
| $y$ |
$-\frac{5}{6}$ |
$\frac{2}{3}$ |
$\frac{13}{3}$ |
Thus the graph can be drawn as follows:
View full question & answer→Question 153 Marks
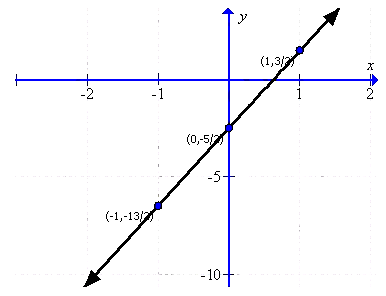
Draw the graph for the linear equation given below:$y=4 x-\frac{5}{2}$
AnswerFirst prepare a table as follows:
| $x$ |
$-1$ |
$0$ |
$1$ |
| $y$ |
$-\frac{13}{2}$ |
$-\frac{5}{2}$ |
$\frac{3}{2}$ |
Thus the graph can be drawn as follows:
View full question & answer→Question 163 Marks
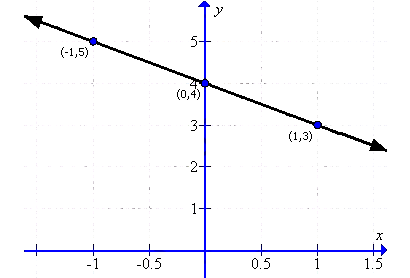
Draw the graph for the linear equation given below$:y = - x + 4$
AnswerFirst, prepare a table as follows:
| $x$ |
$-1$ |
$0$ |
$1$ |
| $y$ |
$5$ |
$4$ |
$3$ |
Thus the graph can be drawn as follows:
View full question & answer→Question 173 Marks
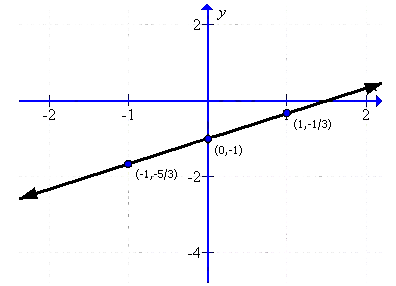
Draw the graph for the linear equation given below:$y=\frac{2 x}{3}-1$
AnswerFirst prepare a table as follows:
| $x$ |
$-1$ |
$0$ |
$1$ |
| $y$ |
$-\frac{5}{3}$ |
$-1$ |
$-\frac{1}{3}$ |
Thus the graph can be drawn as follows:
View full question & answer→Question 183 Marks
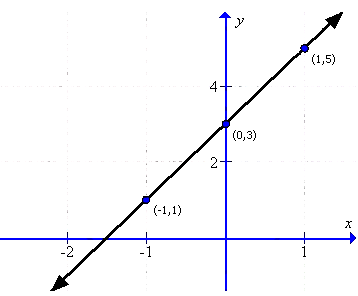
Draw the graph for the linear equation given below$:y = 2x + 3$
AnswerFirst, prepare a table as follows:
| $x$ |
$-1$ |
$0$ |
$1$ |
| $y$ |
$-\frac{5}{3}$ |
$3$ |
$5$ |
Thus the graph can be drawn as follows:
View full question & answer→Question 193 Marks
Draw the graph for the linear equation given below$:x = - 2y$
AnswerFirst prepare a table as follows:
| $x$ |
$-1$ |
$0$ |
$1$ |
| $y$ |
$\frac{1}{2}$ |
$0$ |
$-\frac{1}{2}$ |
Thus the graph can be drawn as follows:
View full question & answer→Question 203 Marks
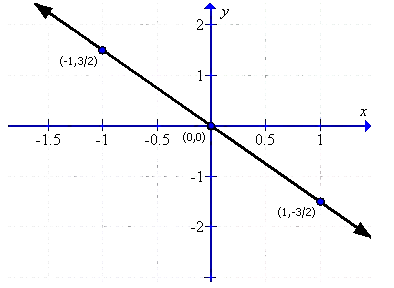
Draw the graph for the linear equation given below$:3x + 2y = 0$
AnswerFirst prepare a table as follows:
| $x$ |
$-1$ |
$0$ |
$1$ |
| $y$ |
$\frac{3}{2}$ |
$0$ |
$-\frac{3}{2}$ |
Thus the graph can be drawn as follows:
View full question & answer→Question 213 Marks
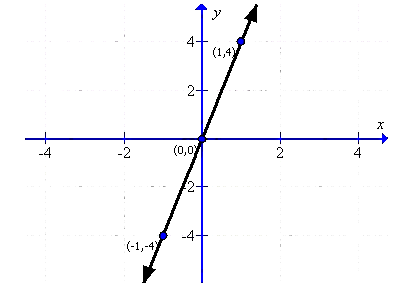
Draw the graph for the linear equation given below$:4x - y = 0$
AnswerFirst, prepare a table as follows:
| $x$ |
$- 1$ |
$0$ |
$1$ |
| $y$ |
$- 4$ |
$0$ |
$4$ |
Thus the graph can be drawn as follows:
View full question & answer→Question 223 Marks
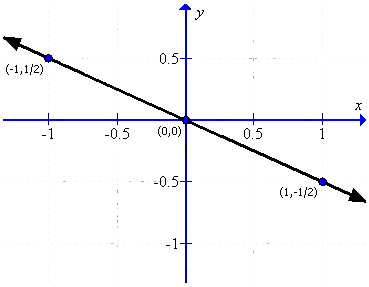
Draw the graph for the linear equation given below$:x + 2y = 0$
AnswerFirst prepare a table as follows:
| $x$ |
$-1$ |
$0$ |
$1$ |
| $y$ |
$\frac{1}{2}$ |
$0$ |
$-\frac{1}{2}$ |
Thus the graph can be drawn as follows:
View full question & answer→Question 233 Marks
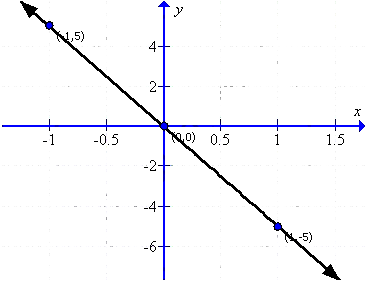
Draw the graph for the linear equation given below$:5x+ y = 0.$
AnswerFirst, prepare a table as follows:
| $x$ |
$- 1$ |
$0$ |
$1$ |
| $y$ |
$5$ |
$0$ |
$- 5$ |
Thus the graph can be drawn as follows:
View full question & answer→Question 243 Marks
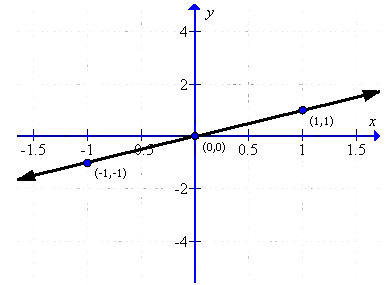
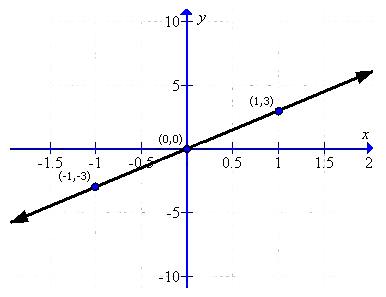
Draw the graph for the linear equation given below$:y = x$
AnswerFirst, prepare a table as follows:
| $x$ |
$- 1$ |
$0$ |
$1$ |
| $y$ |
$- 1$ |
$0$ |
$1$ |
Thus the graph can be drawn as follows:
View full question & answer→Question 253 Marks
Draw the graph for the linear equation given below$:y = - 2x$
AnswerFirst prepare a table as follows:
| $x$ |
$- 1$ |
$0$ |
$1$ |
| $y$ |
$1$ |
$0$ |
$- 1$ |
Thus the graph can be drawn as follows:

View full question & answer→Question 263 Marks
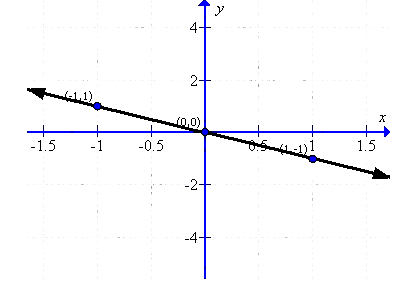
Draw the graph for the linear equation given below$:y = - x$
AnswerFirst prepare a table as follows:
| $x$ |
$- 1$ |
$0$ |
$1$ |
| $y$ |
$1$ |
$0$ |
$- 1$ |
Thus the graph can be drawn as follows:
View full question & answer→Question 273 Marks
Draw the graph for the linear equation given below$:y = 3x$
AnswerFirst, prepare a table as follows:
| $x$ |
$- 1$ |
$0$ |
$1$ |
| $y$ |
$- 3$ |
$0$ |
$3$ |
Thus the graph can be drawn as follows:
View full question & answer→Question 283 Marks
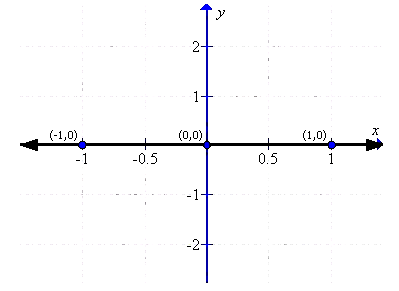
Draw the graph for the linear equation given below$:y = 0$
AnswerFirst prepare a table as follows:
| $x$ |
$-1$ |
$0$ |
$1$ |
| $y$ |
$0$ |
$0$ |
$0$ |
Thus the graph can be drawn as follows:
View full question & answer→Question 293 Marks
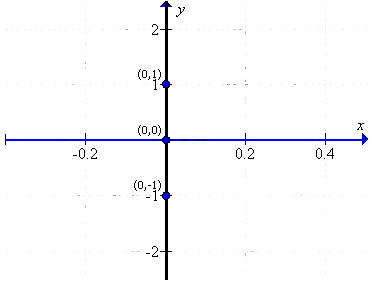
Draw the graph for the linear equation given below$:x = 0$
AnswerFirst prepare a table as follows:
| $x$ |
$0$ |
$0$ |
$0$ |
| $y$ |
$-1$ |
$0$ |
$1$ |
Thus the graph can be drawn as follows:
View full question & answer→Question 303 Marks
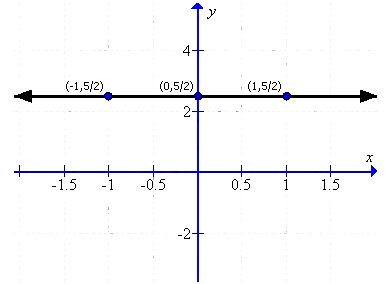
Draw the graph for the linear equation given below$:2y - 5 = 0$
AnswerFirst prepare a table as follows:
| $x$ |
$-1$ |
$0$ |
$1$ |
| $y$ |
$\frac{5}{2}$ |
$\frac{5}{2}$ |
$\frac{5}{2}$ |
Thus the graph can be drawn as follows:
View full question & answer→Question 313 Marks
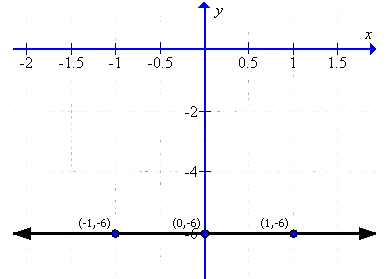
Draw the graph for the linear equation given below$:3y + 5 = 0$
AnswerFirst prepare a table as follows:
| $x$ |
$- 1$ |
$0$ |
$1$ |
| $y$ |
$y = -5/3$ |
$-6$ |
$3y + 5 = 0$ |
Thus the graph can be drawn as follows:
View full question & answer→Question 323 Marks
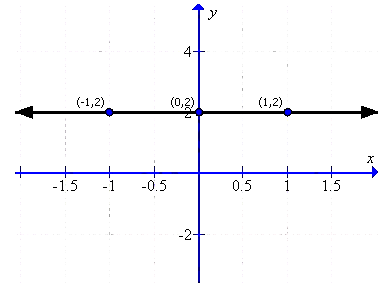
Draw the graph for the linear equation given below$:y - 2 = 0$
AnswerFirst, prepare a table as follows:
| $x$ |
$- 1$ |
$0$ |
$1$ |
| $y$ |
$2$ |
$2$ |
$2$ |
Thus the graph can be drawn as follows:
View full question & answer→Question 333 Marks
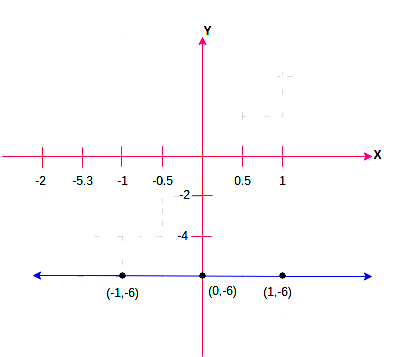
Draw the graph for the linear equation given below$:y + 6 = 0$
AnswerFirst, prepare a table as follows:
| $x$ |
$- 1$ |
$0$ |
$1$ |
| $y$ |
$- 6$ |
$- 6$ |
$- 6$ |
Thus the graph can be drawn as follows:
View full question & answer→Question 343 Marks
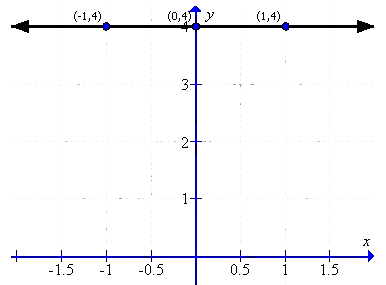
Draw the graph for the linear equation given below$:y = 4$
AnswerFirst, prepare a table as follows:
| $x$ |
$- 1$ |
$0$ |
$1$ |
| $y$ |
$4$ |
$4$ |
$4$ |
Thus the graph can be drawn as follows:
View full question & answer→Question 353 Marks
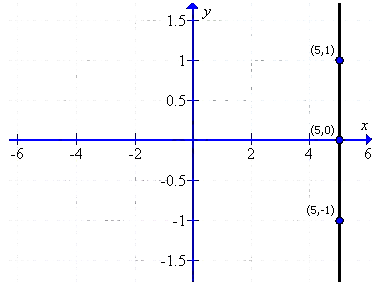
Draw the graph for the linear equation given below$:x - 5 = 0$
AnswerFirst, prepare a table as follows:
| $x$ |
$5$ |
$5$ |
$5$ |
| $y$ |
$-1$ |
$0$ |
$1$ |
Thus the graph can be drawn as follows:
View full question & answer→Question 363 Marks
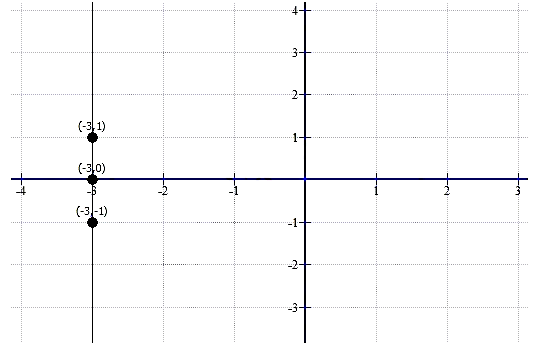
Draw the graph for the linear equation given below$:x + 3 = 0$
AnswerFirst prepare a table as follows:
| $x$ |
$- 3$ |
$- 3$ |
$- 3$ |
| $y$ |
$- 1$ |
$0$ |
$1$ |
Thus the graph can be drawn as follows:
View full question & answer→Question 373 Marks
In the following, find the co-ordinates of the point whose abscissa is the solution of the first equation and ordinate is the solution of the second equation:$\frac{2 a }{3}-1=\frac{ a }{2} ; \frac{15-4 b }{7}=\frac{2 b -1}{3}$.
Answer$\frac{2 a }{3}-1=\frac{ a }{2} ; \frac{15-4 b }{7}=\frac{2 b -1}{3}$
Now
$\frac{2 a}{3}-1=\frac{a}{2}$
$\frac{2 a}{3}-\frac{a}{2}=1$
$\frac{4 a-3 a}{6}=1 $
$a=6$
Again
$\frac{15-4 b}{7}=\frac{2 b-1}{3}$
$45 - 12b = 14b - 7$
$45 + 7 = 14b + 12b$
$52 = 26b$
$2 = b$
$\therefore $ The co$-$ordinates of the point $(6, 2)$
View full question & answer→Question 383 Marks
In the following, find the coordinates of the point whose abscissa is the solution of the first equation and ordinate is the solution of the second equation:$3-2 x=7 ; 2 y+1=10-2 \frac{1}{2} y$.
Answer$3-2 x=7 ; 2 y+1=10-2 \frac{1}{2} y$
Now
$3 - 2x = 7$
$3 - 7 = 2x$
$-4 = 2x$
$-2 = x$
Again
$2 y+1=10-2 \frac{1}{2} y$
$2 y+1=10-\frac{5}{2} y$
$4y + 2 = 20 - 5y$
$4y + 5y = 20 - 2$
$9y = 18$
$y = 2$
$\therefore $ The co$-$ordinates of the point $(-2, 2)$
View full question & answer→Question 393 Marks
By plotting the following points on the same graph paper. Check whether they are collinear or not$:(i) (3, 5), (1, 1)$ and $(0, -1),(ii) (-2, -1), (-1, -4)$ and $(-4, 1)$
Answer
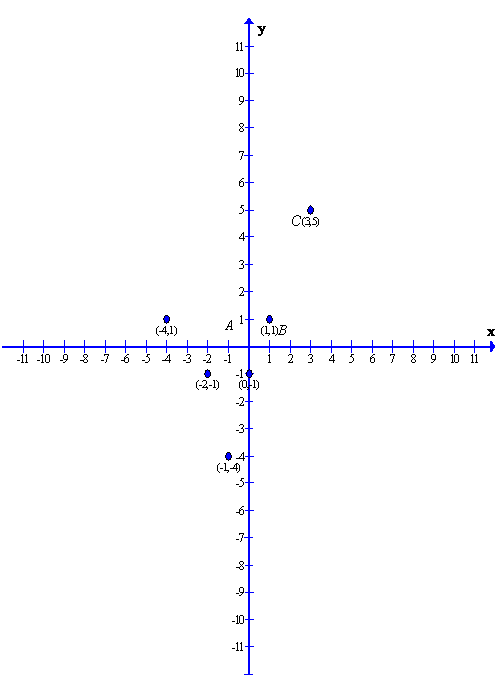
After plotting the given points, we have clearly seen from the graph that
$(i) A(3,5), B(1,1)$ and $C(0,-1)$ are collinear.
$(ii) P(-2, -1), Q(-1,-4)$ and $R(-4,1)$ are non$-$collinear. View full question & answer→