Question
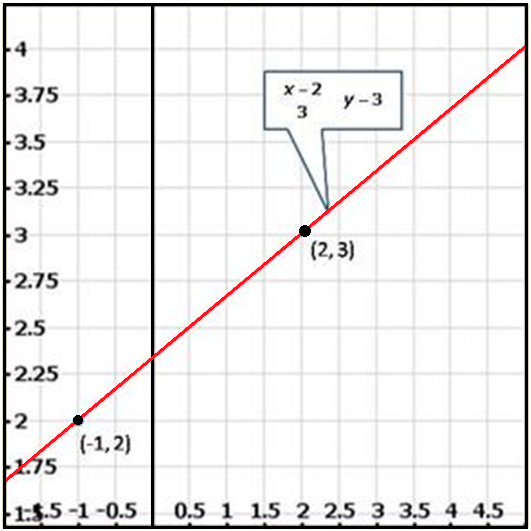
Draw the graph of the following linear equations in two variables:
$\frac{\text{x}-2}{3}=\text{y}-3$
$\frac{\text{x}-2}{3}=\text{y}-3$
Generate a complete, print-ready paper with questions like this in minutes — across 16+ boards, with answer keys.
|
Age (in years)
|
10-20
|
20-30
|
30-40
|
40-50
|
50-60
|
60-70
|
|
No of Patients
|
90
|
50
|
60
|
80
|
50
|
30
|