Question
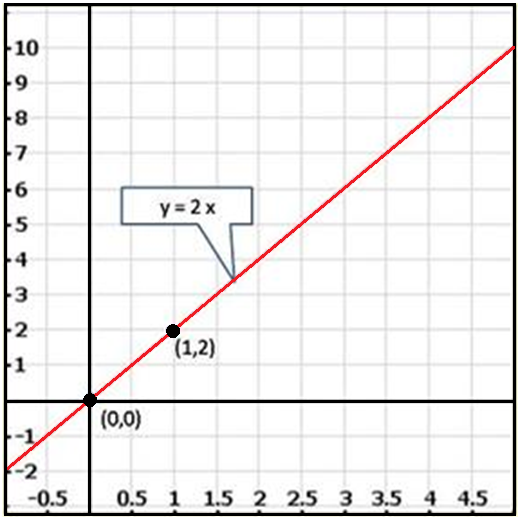
Draw the graph of the following linear equations in two variables:
y = 2x
y = 2x
Generate a complete, print-ready paper with questions like this in minutes — across 16+ boards, with answer keys.
|
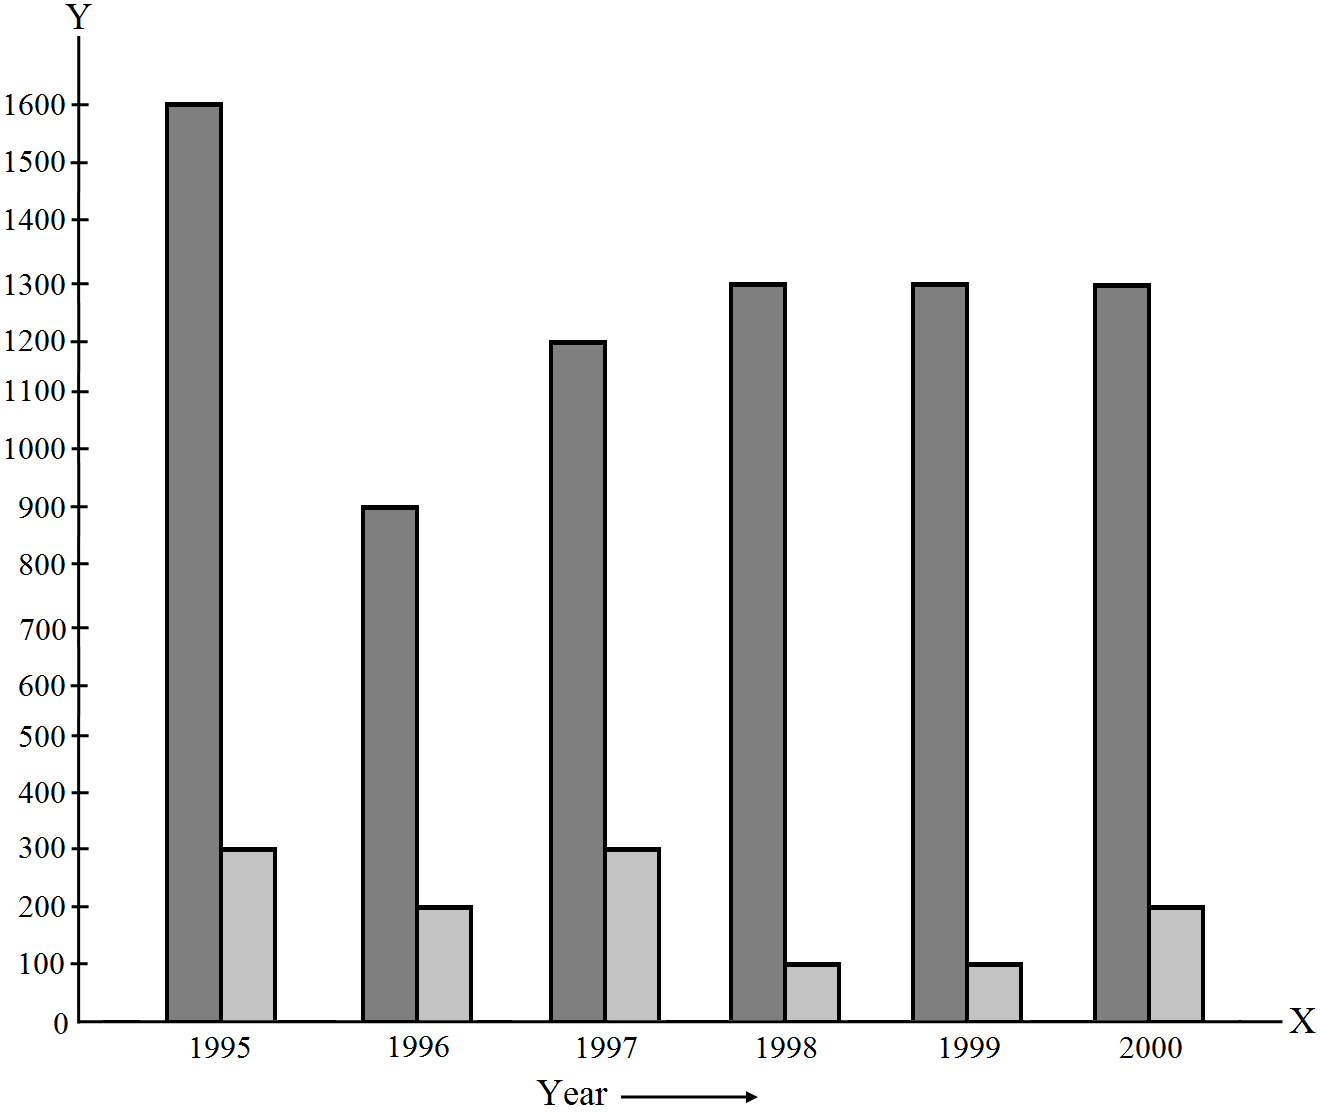
Year
|
1995
|
1996
|
1997
|
1998
|
1999
|
2000
|
|
Number of Applicants Registered (in thousands)
|
18
|
20
|
24
|
28
|
30
|
34
|