Question
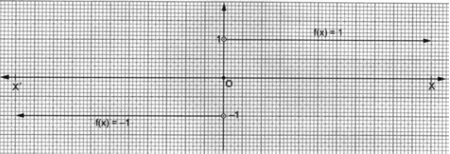
Draw the graph of the signum function, $f : R \rightarrow R$, defined by $f ( x )=\left\{\begin{array}{l}\frac{x}{\mid x}, \text { when } x \neq 0 \\ 0, \text { when } x=0\end{array}\right.$ or $f(x)=\left\{\begin{array}{l}1, \text { if } x>0 \\ 0, \text { if } x=0 \\ -1, \text { if } x<0\end{array}\right.$

Answer

Here we have, $f : R \rightarrow R,$ defined by $f ( x )=\left\{\begin{array}{l}\frac{x}{|x|}, \text { when } x \neq 0 \\ 0, \text { when } x=0\end{array}\right.$
or $f ( x )=\left\{\begin{array}{l}1, \text { if } x>0 \\ 0, \text { if } x=0 \\ -1, \text { if }
x<0\end{array}\right.$
Clearly, we have
We may now draw the graph as shown below.
$x<0 \Rightarrow f(x)=-1$
$x=0 \Rightarrow f(x)=0$
$x>0 \Rightarrow f(x)=1$
We may now draw the graph as shown below. 
Image
Graph of signum function

Need a full question paper?

Generate a complete, print-ready paper with questions like this in minutes — across 16+ boards, with answer keys.

Start Generating Free