Question
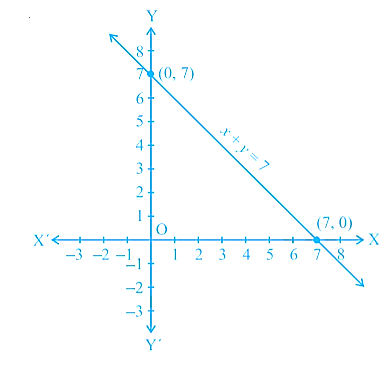
Draw the graph of x + y = 7
To draw the graph, we need at least two solutions of the equation. You can check that x = 0, y = 7, and x = 7, y = 0 are solutions of the given equation. So, you can use the following table to draw the graph:
| x | 0 | 7 |
| y | 7 | 0 |
Draw the graph by plotting the two points from above table and then by joining the same by a line (see Fig.)
Generate a complete, print-ready paper with questions like this in minutes — across 16+ boards, with answer keys.
| Marks $($Class interval$)$ |
$1 - 10$ | $11 - 20$ | $21 - 30$ | $31 - 40$ | $41 - 50$ |
| Number of students $($Frequency$)$ |
$7$ | $10$ | $6$ | $4$ | $3$ |