Question
Draw the graphs showing variation of inductive reactance and capacitive reactance with frequency of applied a.c. source.
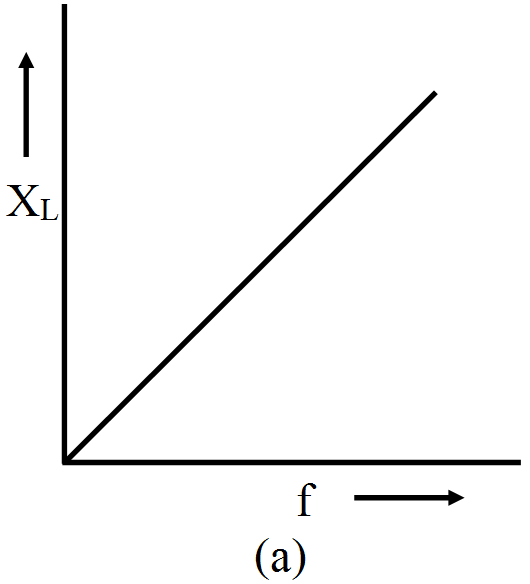
$\text{X}_{\text{L}}=\text{w}_{\text{L}}=2\pi\text{vL};$ graph XL of f and f is a straight line.
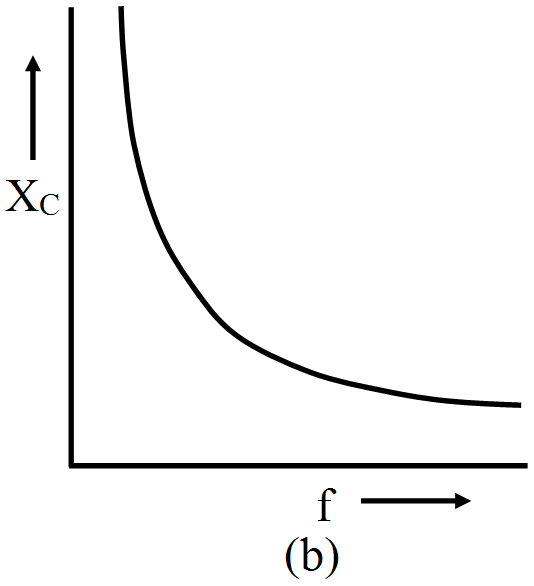
$\text{X}_{\text{C}}=\frac{1}{\omega\text{C}}=\frac{1}{2\pi\text{vC}},$ graph of XC and f is a rectangular hyperbola as shown in figs.
Generate a complete, print-ready paper with questions like this in minutes — across 16+ boards, with answer keys.
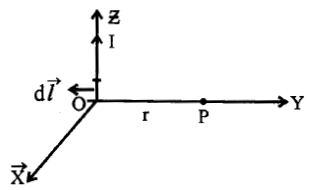
A current I flows in a conductor placed perpendicular to the plane of the paper.Indicate the direction of the magnetic field due to a small element d $\overrightarrow{l}$at point P situated at a distance $ \overrightarrow{r}$ from the element as shown in the figure.