Question
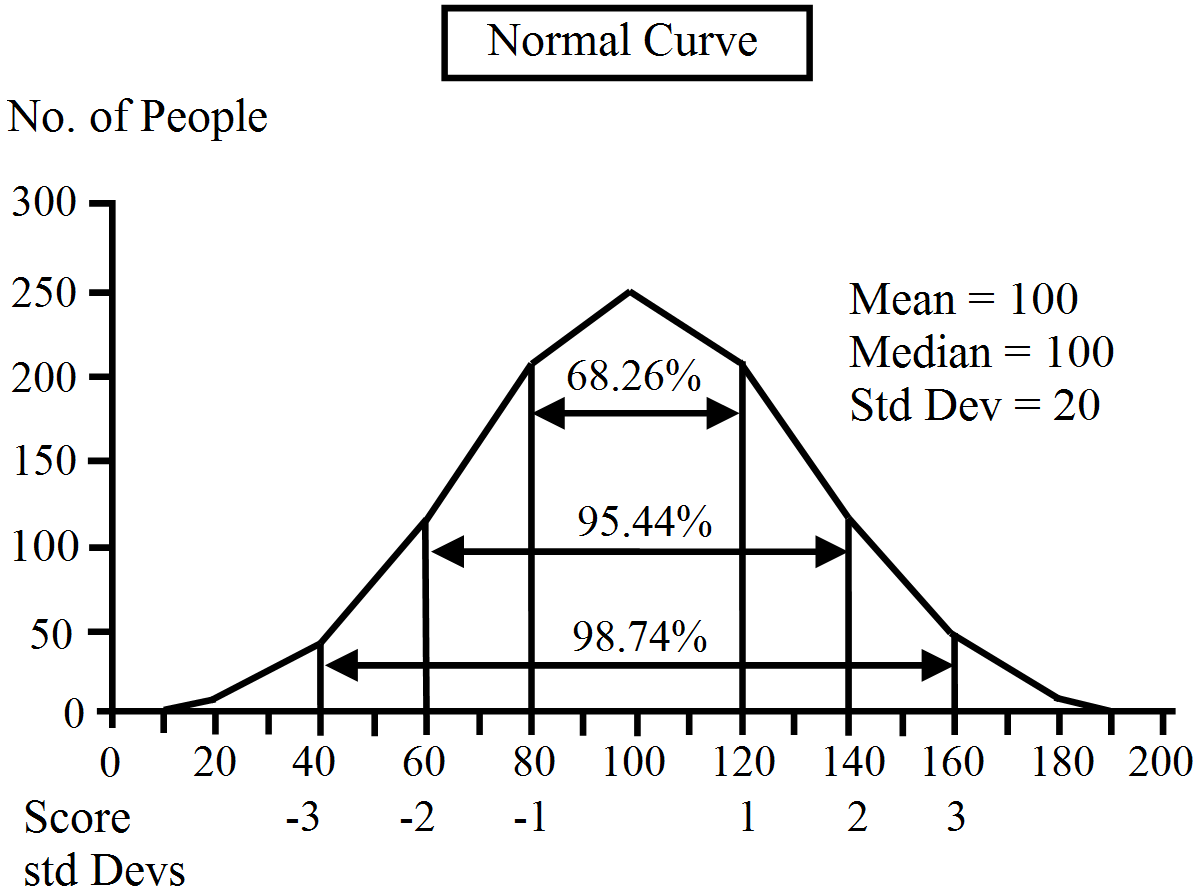
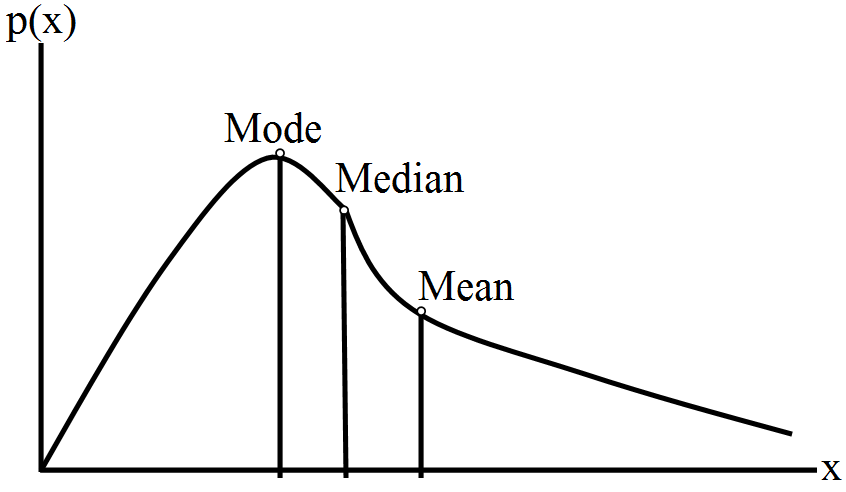
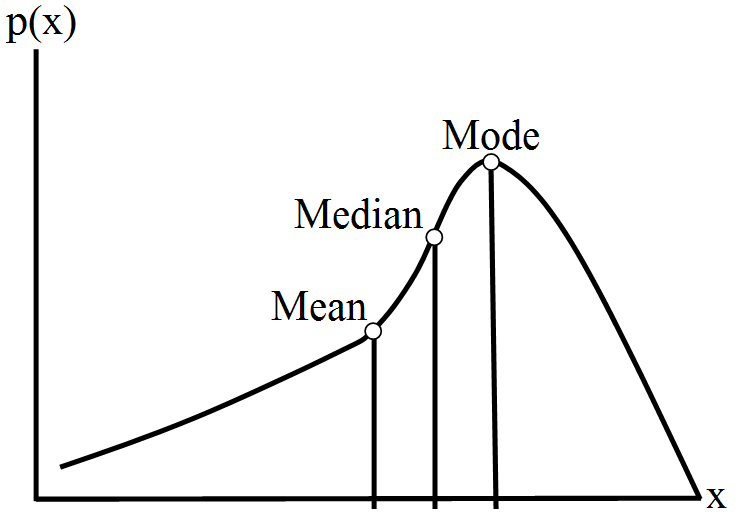
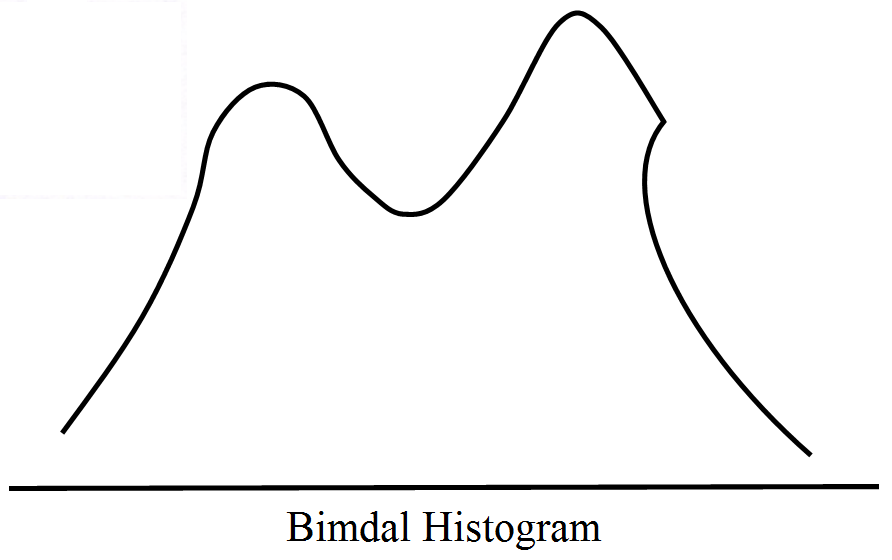
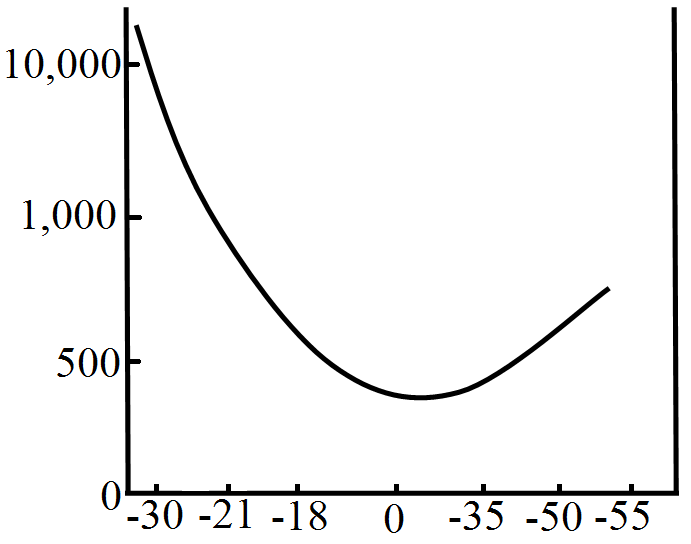
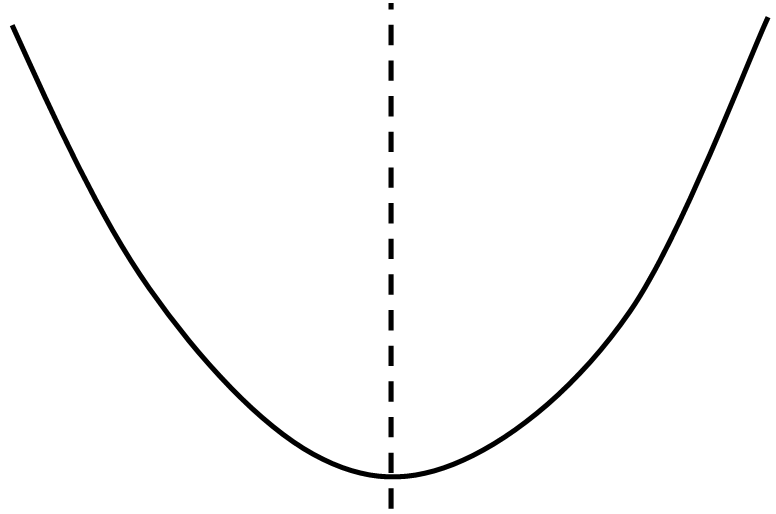
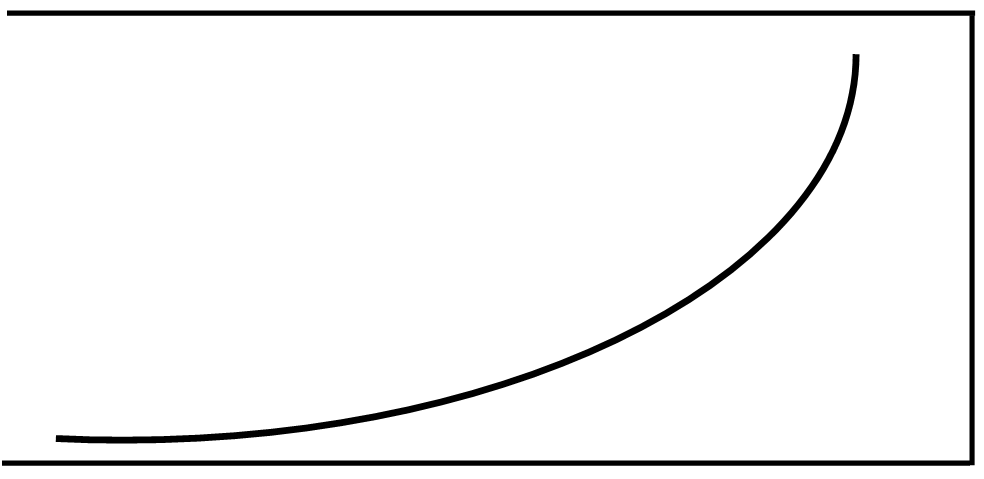
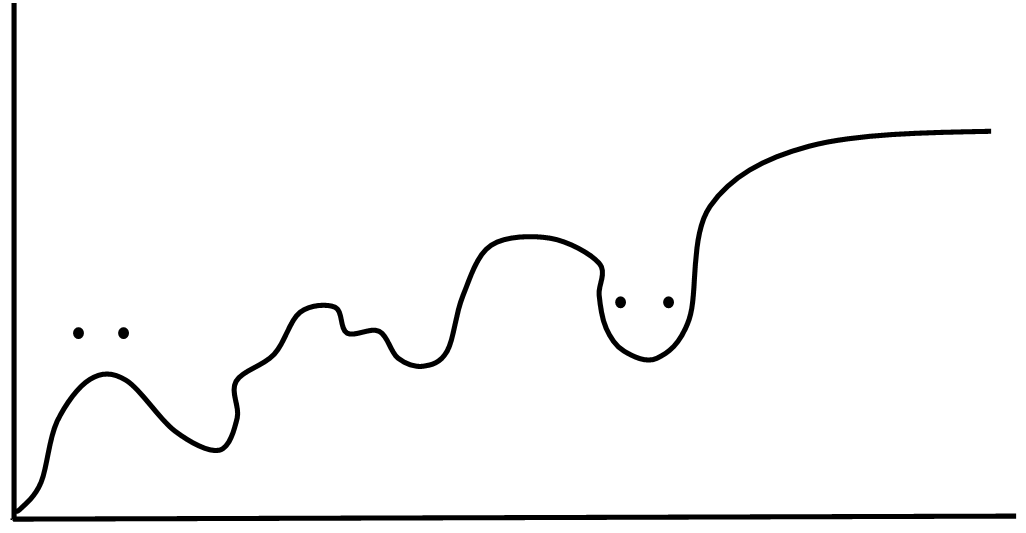
Explain different types of frequency curves with an example.

Answer

  1. Normal Curve: In this curve, highest frequency is at the centre and both tails on the left and right hand side are in identical fashion. It is a unimodal curve in which mean, median and mode are equal. It is also known as bell shaped or symmetrical curve. It is shown below:


Normal Curve Showing the Percent of Cases Lying Within 1, 2, and 3 Standard Deviations from the Mean.
  1. Positively Skewed Curve: It is asymmetrical curve which has a tail on the left hand side of the graph and frequencies are more for the higher values of the data. The left tail is longer, the mass of the distribution is concentrated on the right of the figure. It has relatively few low values. The distribution is said to be left-skewed. It is shown below:
  1. Negatively Skewed Curve: It is asymmetrical curve which has a tail on the right hand side of the graph and frequencies are more for the lower values of the data. These histograms have the curve on the left side of the distribution. If the right tail is longer, the mass of the distribution is concentrated on the left. It has relatively few low values. It is shown below:
  1. Symmetrical Distribution Curve: It is like normal curve but normal curve is unimodal. We can say it to be twins of normal curves. In this curve, highest frequencies are at two places one at a lower value and other at a higher extreme value and hence, it is also called bimodal curve of symmetrical distribution. It is shown below:
  1. J Shaped Curve: When class frequencies running maximum towards higher values and not at the centre, it gives a J shaped frequency curve. It is called so because it appears like English Letter J. It is shown below:
  1. U Shaped Curve: In this case, maximum frequency is at the ends of the data and minimum are the centre. It is shown below:
  1. Reverse J Shaped Curve: When class frequencies are running up to a maximum at one end and not at the centre and it is lower end not higher one, it gives inverse J shaped curve. It is shown below:
  1. Mixed Curve: Sometimes, it is difficult to find a trend in the frequencies. The frequencies rise and fall at different intervals. It is called Mixed Curve. There cannot be one particular shape of mixed curve. It is also called non monotonic curve because it does not show any particular pattern. One example is shown below:

Need a full question paper?

Generate a complete, print-ready paper with questions like this in minutes — across 16+ boards, with answer keys.

Start Generating Free

Similar questions

To check the quality of two brands of lightbulbs, their life in burning hours was estimated as under for 100 bulbs of each brand.
Life
No. of bulbs
(in hrs.)
Brand A
Brand B
0-50
15
2
50-100
20
8
100-150
18
60
150-200
25
25
200-250
22
5
 
100
100
  1. Which brand gives higher life?
  2. Which brand is more dependable?
Draw a production possibility curve and indicate the following situations on the diagram:
(i) Fuller and efficient utilisation of resources,
(ii) Underutilisation of resources, and
(iii) Growth of resources.
What do you mean by positive and negative correlation?
Explain the effect of the following three situations:
(i) Effect of change in demand on the equilibrium price when supply is constant.
(ii) Effect of change in supply on the equilibrium price when demand is constant.
(iii) Effect of simultaneous change in demand and supply on equilibrium price.
Explain briefly the advantages and limitations of graphical presentation of data.
Calculate the value of median, first quartile $(Q_1)$ and third quartile $(Q_3)$ from the following data.
Marks
Number of Students
30-35
14
35-40
16
40-45
18
45-50
23
50-55
18
55-60
8
60-65
3
Define index number. Discuss various problems in the construction of index numbers.
Read the following case study carefully and answer the questions 1-6 on the basis of the same:
An economic system is a set of principles based on which an economy can run and make decisions about which goods and services to produce, how to produce and exchange them, how should the income from the production be distributed among the factor resources and what shall be the right balance between public sector and private sector and that between free market mechanism and regulation. Capitalism is an economic system based on certain principles, like provision of private property rights, free market economy and allowing economic agents (consumers and producers) to pursue private motives and self-interest with no or minimal government intervention. In an open economy and free trade environment, countries should produce the goods domestically in which they have comparative advantage. Comparative advantage principle states that if a country can produce a particular good at least opportunity cost comparatively than the rest of the world, then the country has comparative advantage in producing that good.

1. In _________ the degree of consumer sovereignty is highest.
(a) market economy
(b) centrally planned economy
(c) mixed economy
(d) both (a) and (c)

2. Which of the following is not a feature of centrally planned economy?
(a) Control of central authority
(b) Ownership of resources by government
(c) Consumer sovereignty
(d) Dominance over economic activity by public sector

3. Which among the following countries is not capitalistic or market driven in nature?
(a) Hong Kong
(b) Ireland
(c) Russia
(d) Canada

4._________economy is an economy in which the degree of interdependence and exchange is of a moderate degree.
(a) Simple
(b) Complex
(c) Both (a) and (b)
(d) None of these

5. Read the following statements carefully and choose the correct alternative among those given below:
Statement 1 : In a simple economy, income level of the people is low.
Statement 2 : In a complex economy, wants are multiple as well as enormous.
Alternatives:
(a) Both the statements are true
(b) Both the statements are false
(c) Statement 1 is true and Statement 2 is false
(d) Statement 2 is true and Statement 1 is false

6. In mixed economy, both public and private sectors dominate the economic activity.
Find out the mean deviation from arithmetic mean from the given data.
Class lnterval: 0-10 10-20 20-30 30-40 40-50
Frecquency: 2 4 6 4 2