Chemical Kinetics — Chemistry STD 12 Science — Question
Maharashtra BoardEnglish MediumSTD 12 ScienceChemistryChemical Kinetics2 Marks
Question
Explain graphical method to determine activation energy of a reaction .
✓
Answer
The Arrhenius equation is given by
$k=A e^{\frac{-E_a}{R T}}$
On taking logarithms of both sides, we get
$\log _n k=\log _n A-\frac{E_a}{R T}$
or
$\log _{10} k=-\frac{E_a}{2.303 R T}+\log _{10} A$
$\log _{10} k=-\frac{E_a}{2.303 R} \times\left(\frac{1}{T}\right)+\log _{10} A$
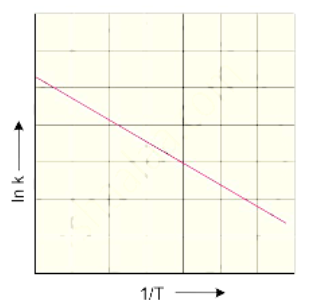
The rate constant of a reaction is determined at various temperatures.
$log_{10}k$ is plotted against the reciprocal of temperature. The graphical
representation is
The slope of the straight line graph is
$-\frac{E a}{2.303 R}$
from which the activation energy can be calculated.
Need a full question paper?
Generate a complete, print-ready paper with questions like this in minutes — across 16+ boards, with answer keys.