Question
Explain national income equilibrium through aggregate demand and aggregate supply. Use diagram. Also explain the changes that take place in an economy when the economy is not in equilibrium.
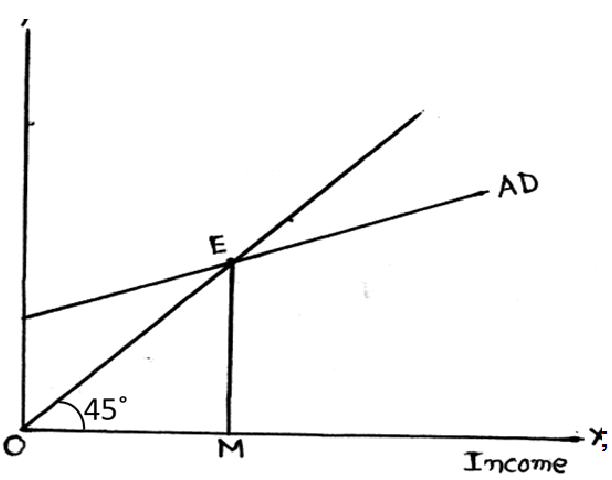
The national income is in equilibrium when AD = AS. In the figure the equilibrium is at E, the intersection of the AD curve and the 45o line. The equilibrium income is OM.
When the economy is not in equilibrium AD is not equal to AS. Suppose AD>AS, will lead to fall in inventories with the producers. The producers in turn will produce more to reach the desired level of inventories: This raises AS till it becomes equal to AD.
Generate a complete, print-ready paper with questions like this in minutes — across 16+ boards, with answer keys.
| S. No. | | (₹ in lakhs) |
| (i) | Units of output sold (units). | 1,000 |
| (ii) | Price per unit of output. | 30 |
| (iii) | Depreciation. | 1,000 |
| (iv) | Depreciation. | 12,000 |
| (v) | Closing stock. | 3,000 |
| (vi) | Opening stock. | 2,000 |
| (vii) | Excise duty. | 2,500 |
| (viiii) | Sales tax. | 3,500 |
| Q | SMC |
| 0 1 2 3 4 5 6 | - 500 300 200 300 500 800 |
OR
Explain the steps taken in derivation of the saving curve from the consumption curve. Use diagram.