Question
Explain ‘Paradox of Thrift’.

Answer

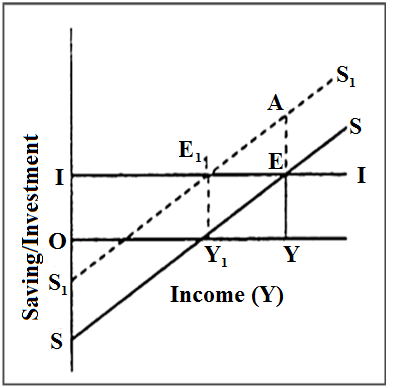
Paradox of thrift: Since start of human civilisation it was considered a virtue to keep consumption level at the minimum but the lasting effects and chain reactions of keeping consumption in check were not realised. People were taught that thrift or savings are good because a penny saved today will bring increased income. In this connection, Keynes pointed out paradox of thrift and showed that as people become more thrifty, they end up saving less or same as before. If all the people of an economy increased the proportion of income which is saved (i.e., MPS), the value of savings in the economy will not increase, rather it will decline or remain unchanged. Let us understand this statement with the help of the figure.
In Fig, initial saving curve is SS and investment curve is II. Economy attains equilibrium (saving = investment) at E and equilibrium level of income is OY. Now, suppose the society decides to become thrifty and increases saving by, say, AE. As a result saving curve shifts upward to S1S1 intersecting investment curve II at E1 Unplanned inventories will increase and firms will cut down production and employment and move to new equilibrium E1 The Figure shows that in the end, planned saving has fallen from AY to E1Y1. Notice at new point of equilibrium E1,, the investment level and also realised saving remain the same (E1Y1) but level of income has fallen from OY to OY1. The decline in equilibrium level of income shows the paradox of thrift as the reverse process of multiplier has worked on reducing consumption expenditure. In fact, increased saving is virtually a withdrawal from circular flow of income.

Need a full question paper?

Generate a complete, print-ready paper with questions like this in minutes — across 16+ boards, with answer keys.

Start Generating Free

Similar questions

Explain producer’s equilibrium with the help of a marginal cost and marginal revenue schedule.
The equilibrium level of income in an economy is ₹ 1,000 crore. The autonomous consumption expenditure is equal to ₹ 100 crore and investment expenditure ₹ 500 crore.

Calculate:

  1. Consumption expenditure at equilibrium level of national income,
  2. Marginal Propensity to save,
  3. Saving Function;
  4. Break-even level of Income.
State the behaviour of marginal product in the law of variable proportions. Explain the causes of this behaviour.

OR

Giving reasons, explain the law of variable proportion.

OR

 What are the different phases in the Law of Variable Proportions in terms of marginal product? Give reason behind each phase. Use diagram.

Write down some of the limitations of using GDP as an index of welfare of a country.
Explain the implications of the following:
  1. Product differentiation in monopolistic competition.
  2. Perfect knowledge in perfect competition.
  1. Explain briefly the situation of excess demand in a perfectly competitive market. Use diagram.
  2. Explain briefly the situation of excess supply in a perfectly competitive market. Use diagram.
Calculate TR and AR at each level of output.
Output(Units) MR(₹) TR(₹) AR(₹)
1 10 -- --
2 8 -- --
3 0 -- --
4 -2 -- --
What is ‘effective demand’? How will you derive the autonomous expenditure multiplier when price of final goods and the rate of interest are given?
State the different phases of changes in Total Product and Marginal Product in the Law of Variable Proportions. Also show the same in a single diagram.
The following table shows the total cost schedule of a firm. What is the total fixed cost schedule of this firm? Calculate the TVC, AFC, AVC, SAC and SMC schedules of the firm.
Q
TC
0
1
2
3
4
5
6
10
30
45
55
70
90
120