Question
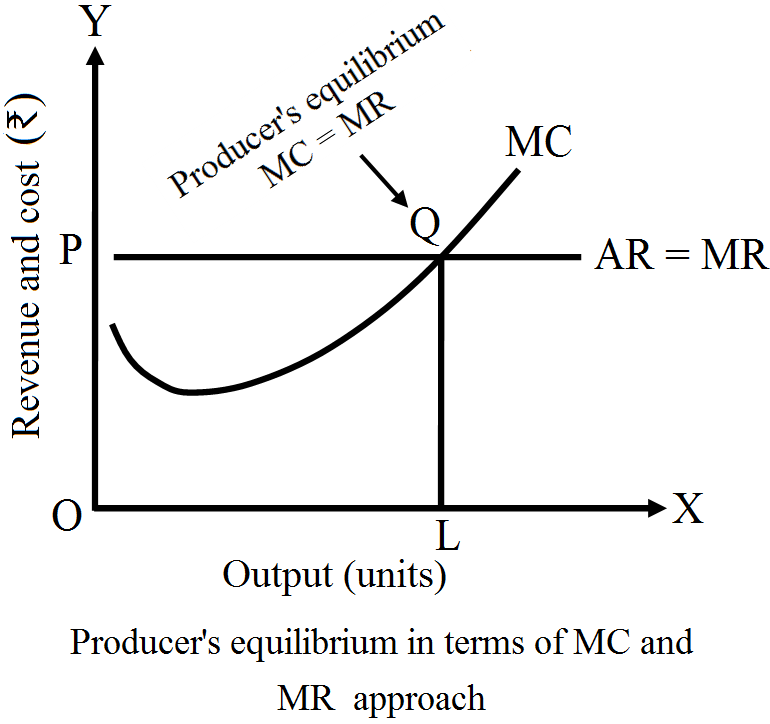
Explain producer's equilibrium with the help of a diagram.

Answer

Producer's equilibrium refers to a situation of profit maximisation or cost minimisation. To study producer's equilibrium, two approaches are used
  1. Total Revenue and Total Cost approach: Under this approach, a producer is deemed to be in equilibrium, on the fulfillment of the following two conditions
  1. The difference between TR and TC is the maximum.
  2. Total profits are falling after this level of output.
  1. Marginal Revenue and Marginal Cost approach Under this approach, a producer attains equilibrium on the fulfillment of the following two conditions:
  1. MR = MC
  2. MC is rising after the point of equilibrium.

Need a full question paper?

Generate a complete, print-ready paper with questions like this in minutes — across 16+ boards, with answer keys.

Start Generating Free

Similar questions

Explain the conditions of a producer's equilibrium in terms of marginal cost and marginal revenue. Use diagram.
What precautions should be taken while estimating national income by expenditure method? Explain.
From the following data, calculate “national income” by (1) income method and(2) expenditure method:
    (Rs. in crores)
1 Interest. 150
2 Rent. 250
3 Government final consumption expenditure. 600
4 Private final consumption expenditure. 1200
5 Profits. 640
6 Compensation of employees. 1000
7 Net factor income to abroad. 30
8 Net indirect taxes. 60
9 Net exports. (-)40
10 Consumption of fixed capital. 50
11 Net domestic capital formation. 340
Explain the consumption function with the help of schedule and diagram.
Market for a good is in equilibrium. There is increase in demand for goods. Explain the chain of effects of this change. Use diagram.###How does an increase in demand of a commodity affect its equilibrium price and equilibrium quantity? Explain with the help of a diagram.###How will equilibrium price and quantity be affected when there is rightward shift of demand curve?### X and Y are complementary goods. The price of Y falls. Explain the chain of effects of this change in the market of X.
Explain various degrees of price elasticity of supply. Use diagrams.
While estimating national income, how will you treat the following? Give reasons for your answer.
  1. Imputed rent of self-occupied houses.
  2. Interest received on debentures.
  3. Financial help received by flood victims.
What is ‘effective demand’? How will you derive the autonomous expenditure multiplier when price of final goods and the rate of interest are given?
Calculate (a) National Income, and (b) Net National Disposable Income:
    (in crores)
(i) Compensation of employees 2,000
(ii) Rent 400
(iii) Profit 900
(iv) Dividend 100
(v) Interest 500
(vi) Mixed income of self-employed 7,000
(vii) Net factor income to abroad 50
(viii) Net exports 60
(ix) Net indirect taxes 300
(x) Depreciation 150
(xi) Net current transfers to abroad 30
Explain through a diagram the effect of a rightward shift of both the demand and supply curves on equilibrium price and quantity.