Question
Explain the concept of fixed cost, variable cost and total cost with diagram.
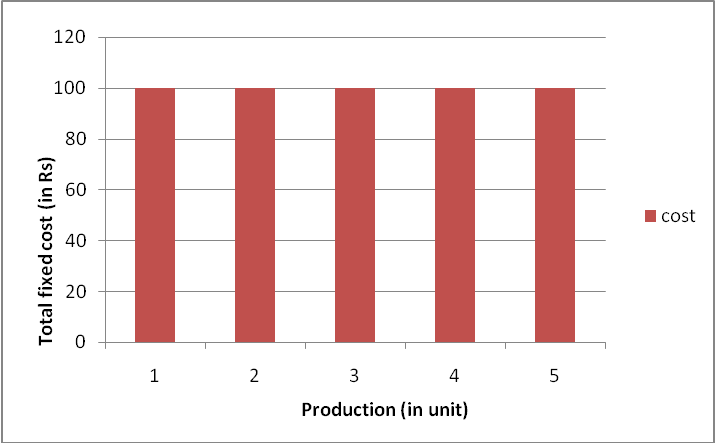
Answer

 
  • Introduction :-
    • The classification of fixed cost and variable cost in reference to only short term.
    • All cost become variable cost in long term.
    • Short term means where firms can not expand Its volume.
    • But production can be increase with the use of established production power.
    • When in the unit of production's volume can be increased or decreased in long run.
    • In short, period, plant, machinery, etc. are fixed factors. but with increase or decrease in proportion of raw material, labours, electricity, etc. can be effect the production.
  • Fixed cost :
  • Meaning :
    • The cost which having no changes with production increase, decrease or remain steady in short term, that is fixed cost.
    • The fixed costs have no relations with the unit of short term.
    • With the increase or decrease in production, there is no change in cost is known as fixed cost.
  • Example :
    • Generally, in fixed cost the factory or buildings rent, wages of permanent labours, interest on capital, license fee, insurance, property tax, etc. costs are included.
  • For example :
    • If 10 labourers employed as permanent staff in same factory and by any reason the factory closed for four months even though the wages to be paid to this labourers.
    • That is fixed cost. Prof. Marshall introduced this cost as supplementary cost, because the proportion of production is not connected directly with fixed cost.
  • Schedule and Figure :
    • We can see in the schedule, with the Production commodity of x the following fixed cost is occur.
Production (in unit) Total fixed cost (in Rs.)
$00$ $100$
$1$ $100$
$2$ $100$
$3$ $100$
$4$ $100$
$5$ $100$
  • From the above schedule the production units from zero to $1,2,3,4,5$ units even though the Total Fixed Cost ($TFC$) $Rs. 100$ is remain constant.
  • Presentation Through Figure :
  • In the above figure we measure units of $x$ commodity on $OX$ line (horizontal) and on vertical line ($0Y$ line) production cost measured.
  • According to schedule the production zero $1. 2, 3, 4. 5,$ units which $a, b, c. d, e$ in the figure.
  • At every point $100$ remain constant.
  • After joining all the points than we get Total Fixed Cost $(TFC)$ curve which is parallel to the base $(0X)$ line.
  • Variable cost :
  • Meaning :
    • Variable cost depends on production volume.
    • Generally, the cost which increase with the production and decrease when production decreases and it becomes zero when production is closed, that is variable cost.
    • If changes in production size, it changes the cost in short run.
    • The variable cost can be called unstable or prime or direct cost.
    • This cost directly connected with the units of production.
  • Example :
    • Generally, in the process of production the fuel cost, temporary labours wages, raw material cost, transportation cost, Sale taxes, electricity etc, costs are variable cost.
    • When production increased then this cost also increased and at one time if production closed then this cost also remain zero.
    • E.g. If factory closed for some time by any reason, neither the labours of daily wages paid nor the cost of raw materials paid.
    • The difference between variable cost and fixed cost is only for short term.
    • The all costs becomes variable in long-run.
    • Schedule and figure :
    • The Total Variable Cost $(TVC)$ for the production of x commodity in short run given below.
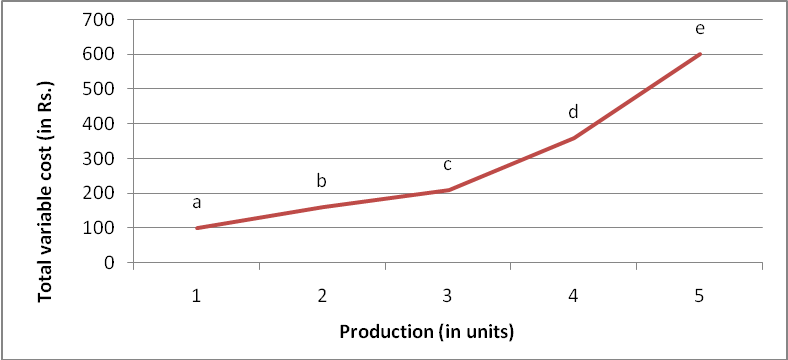
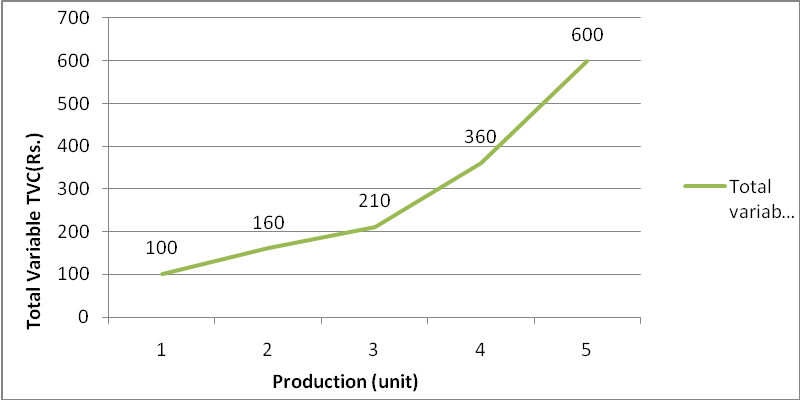
Production
(in units)
Total Variable
Cost (in Rs.)
$00$ $00$
$1$ $100$
$2$ $160$
$3$ $210$
$4$ $360$
$5$ $600$
  • In the above schedule it can be shown that when production is closed then total variable cost also become zero, but where the production start to increase then total variable cost increases.
  • At Unit $1$ it is $Rs. 100$, at unit $2 Rs. 160$, at unit $3 Rs. 210$, at unit $4 Rs. 360$ and at unit $5 Rs. 600$, that is total variable cost.
  • In the figure, we see the points $a, b, c, d$, and $e.$ In the beginning variable cost increased at diminishing rate and after some stages its increased at increasing rate.
  • In the beginning, cost decreased that means the law of diminishing cost and after optimum level it seems the law of increased cost, so this condition occur in our example; up to unit $3$ at diminishing rate, and from unit $4$ at increasing rate the variable cost increasing.
  • Presentation Through Figure :
  • In the above figure the units of commodity x measured on $OX$ line or horizontal line and the total variable cost measured on $OY$ line or vertical line.
  • According to schedule, when production is zero, $1, 2, 3. 4, 5$ units, the total variable cost increasing according to $a,b,c,d,$ and $e.$
  • Total variable cost curve start from origin and then after in positive slope. Beginning at diminishing rate and after optimum level at increasing rate, the $TVC$ curve shows.
  • Total Variable Cost two curve start from origin because total variable cost is zero at zero production.
  • Total Cost (TFC + P/C) :
  • Meaning :
    • The total cost can be known by addition of total fixed cost and total variable cost.
    • The proportion of production and total cost have straight relation.
    • Where the production increase the total cost increasing. In short, sum of total fixed cost and total variable cost is equal to total cost.
  • See it by following equation :
  • $TC = TFC + TVC$
  • Schedule and Figure :
  • While doing a production of x commodity, the total fixed cost and total variable cost is remain as the follow.
  • The total cost schedule can be obtained by doing summation of $TFC$ and $TVC.$
 
Production
(Unit)
Total fixed
TFC
(RS.)
Total Variable
TVC
(Rs.)
Total Cost
TFC + TVC
(Rs.)
$00 $100$ $00$ $100$
$1$ $100$ $100$ $200$
$2$ $100$ $160$ $260$
$3$ $100$ $210$ $310$
$4$ $100$ $360$ $460$
$5$ $100$ $600$ $700$
  • In above figure production units are given on $OX$ horizontal axis and cost is shown on $OY$ vertical axis.
  • From the figure it can be shown that $Z 100$ is short term fixed cost.
  • So we can see the total fixed cost curve is parallel to horizontal axis.
  • When in the short term the Total Variable Cost ($TVC$) increase due to increase in production.
  • So the $OP$ curve see with positive slope from the starting (origin) point.
  • When the production is zero the $TVC$ also zero and this curve is start from origin.
  • In figure, total cost curve shown by $AO$. 'Total cost increase with increase in production.
  • So total cost curve also shown with positive slope.
  • In total cost, total fixed cost $+$ total variable cost are included.
  • And at zero production, total fixed cost is t $100$ and total cost also $100 Rs$. So, total cost curve start with A point instead of origin point but from $OY$ vertical axis and shown with positive slope.
  • The second main thing must be noted that for short time period.
  • Fixed cost is not changed.
  • So the changes occurred in total cost with production is same as total variable cost.
  • So both the $TVC$ and $TC$ curve seen with positive slope and at some distance from the each other.
  • Total cost curve seen upper side from total variable cost curve.
  • And the distance between both curve is same.
  • Following conclusion are made from the above figure.
  • If production is zero then total fixed cost is $Rs. 100.$
  • If production is zero then total variable cost is $Rs. 0$ (zero).
  • If production is zero then also total cost is $Rs. 100.$
  • It means that because of total variable cost zero, total fixed cost $AO (100)$ and total cost $AO (100)$ is seen.
  • When production is $0Q1$, then we obtained total cost $DQL$ by totaling both total cost $CQL$ and total variable cost dc.
  • At third unit of production we get optimum stage. At that time total cost is $fQ2.$
  • In which $TFC$ is same as g$Q2$ and $TVC$ is same as fg.
  • In this figure, distance between dc and fe are same.

Need a full question paper?

Generate a complete, print-ready paper with questions like this in minutes — across 16+ boards, with answer keys.

Start Generating Free