Question
Explain the different method of measuring Price Elasticity of Demand.
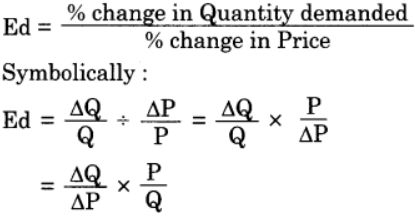
ΔQ = Change in demand (Original – new ( quantity)
ΔP = Change in price (Original – new price)
Q = Original quantity
P = Original price
By applying the above formula we can ( calculate and find the type of elasticity. If the ) result is one, then elasticity is unitary. If it
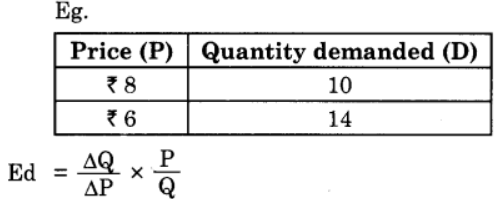
So the commodity has Relatively Elastic Demand e > 1.
If the Answer was < 1 then it would have been relatively inelastic.
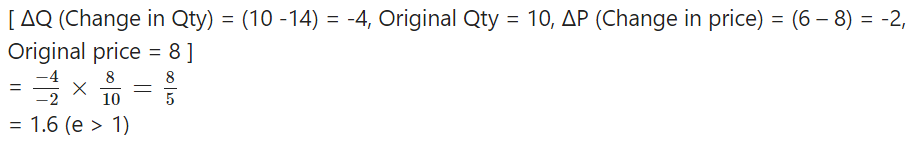
(B) Total Outlay Method : This method was introduced by Dr. Alfred Marshall. The limitation of this method is that in this method unlike ratio method, the exact numerical value of the elasticity of demand cannot be determined. According, to this method, the elasticity of demand is measured on the basis of expenditure incurred by consumer when the price of a commodity changes.
Total outlay or total expenditure can be calculated by multiplying the price with the quantity demanded (Price x Quantity demand = Total Expenditure). Depending upon the kind of change in total outlay, whether it increases, or decreases, or remain constant with the change in price we will be able to decide the type of elasticity. This can be explained with the following example:-
(1) If the total outlay remains the same with a rise or fall in price then the demand is said to be unitary (e = 1) elastic.
(2) If the total outlay decreases with a rise in price and increases with a fall in price, the elasticity of demand is greater than one or Relatively Elastic e > 1.
(3) If the total outlay increases with a rise in price and decreases with a fall in price, then elasticity is less than one or relatively inelastic, e < 1.
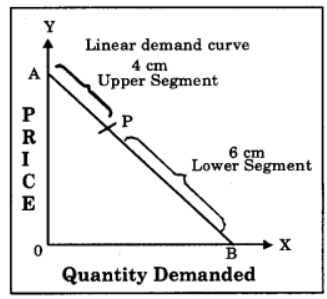
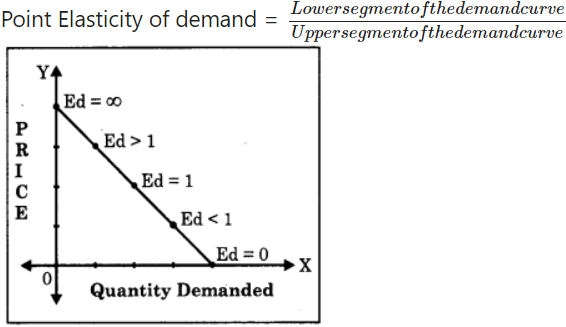
(C) Point Method : In this method given by Prof. Marshall we will be able to find out elasticity at a point on a given demand curve.
To find out elasticity at any given point ‘P on a linear demand curve DD (Straight Line) extend the demand curve towards Y axis and X axis to meet at point A and B respectively as shown in the diagram. Then measure the distance of segment PA and segment PB. Then divide the distance of lower segment PB by upper segment PA.
Suppose the distance of lower segment PB is 6 cm and upper segment PA is 4 cm.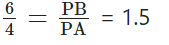
Then Elasticity at point “P” is 1.5 which is e > 1. So demand is Relatively Elastic. On a given linear demand curve elasticity of demand at different point is different as shown in the diagram.
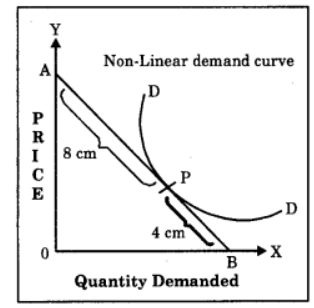
Now to find elasticity of demand on a non-linear demand curve on a given point “P” as shown in the diagram. First draw a tangent line AB to meet Y and X axis at Point A and B. Then divide the
PB
lower Seg PB by the upper Seg PA i.e. $\frac{ PB }{ PA }$
Suppose distance PA'is $8 cm$ and $PB$ is $4 cm$, then $E D=\frac{4}{8}=0.5$ i.e. $e <1$. It is a case of Relatively Inelastic demand.
Generate a complete, print-ready paper with questions like this in minutes — across 16+ boards, with answer keys.
1. Subdivided Bar Diagram
Diagram 1 : Share of GDP by Sector for Selected Nations (2017)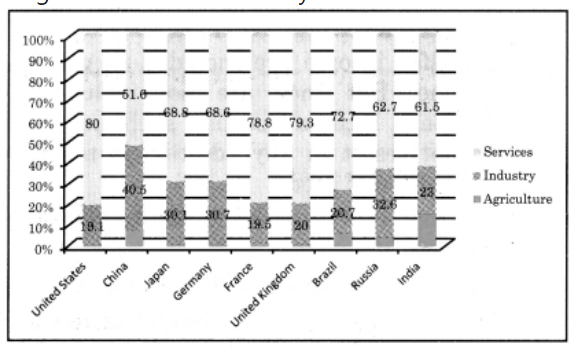
QU.1. Which are the sectors contributing in National Income / GDP?
QU.2. In the United States GDP, which sectors contribution is maximum and how much percent?
QU.3. In which country, contribution of primary ‘ sector (agriculture) is lowest in GDP?
QU.4. How much is the share of agriculture in India’s National Income in the year 2017?
QU.5. In which country, the share of industry is maximum and how much percent?
QU.6. Give your opinion on sectorwise contribution in India’s GDP.