Question
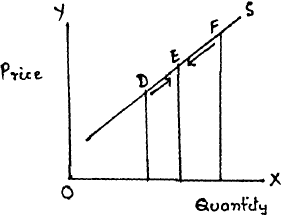
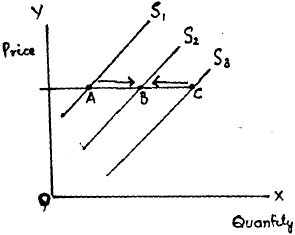
Explain the distinction between "change in quantity supplied" and "change in supply". Use diagram.

Answer


Change in Quantity supplied' refers to change in supply due to own price of the good only. It means movement along the same supply curve. It is called extension when supply rises (from D to E) and contraction when supply fall (from F to E).
Change in supply' refers to change in supply due to factor other than the own price of the good like change in prices of inputs etc. This leads to shift of supply curve, It is called 'increase' when supply rises (from A to B) and 'decrease' when supply falls (from C to B).

Need a full question paper?

Generate a complete, print-ready paper with questions like this in minutes — across 16+ boards, with answer keys.

Start Generating Free

Similar questions

Explain the conditions of consumer's equilibrium using indifference curve analysis.

OR

consumer consumes only two goods. Explain the conditions of consumer equilibrium with the help of indifference curve analysis. Use diagram.

OR

Explain the conditions of consumer equilibrium with the help of indifference curve analysis. Use diagram.

OR

Use indifference curve approach, explain the conditions of consumer's equilibrium.

OR

What are the conditions of consumer's equilibrium under indifference curve approach? What changes will take place if the conditions are not fulfilled to reach equilibrium?

Calculate ‘Net Domestic Product at Market Price’ and ‘Gross National Disposable Income’:
 
 
(₹ crore)
(i)
Private final consumption expenditure
400
(ii)
Opening stock
10
(iii)
Consumption of fixed capital
25
(iv)
Imports      
15
(v)
Government final consumption expenditure
90
(vi)
Net current transfers to rest of the world
5
(vii)
Gross domestic fixed capital formation          
80
(viii)
Closing stock              
20
(ix)
Exports
10
(x)
Net factor income to abroad
(-5)
If equilibrium price of a good is greater than its market price, explain all the changes that will take will place in the market. Use diagram.
Show diagrammatically the conditions for consumer's equilibrium, in Hicksian analysis of demand.
Explain with the help of a diagram, how equilibrium level of income in an economy is determined by saving and investment curves? Will there always be full employment at equilibrium level of income?
Give the meaning of 'foreign exchange' and 'foreign exchange rate'. Giving reason, explain the relation between foreign exchange rate and demand for foreign exchange.
  1. Define price elasticity of demand.
  2. If the price of a commodity rises by 40% and its quantity demanded falls from 150 units to 120 units, calculate coefficient of price elasticity of demand for the commodity.
Explain various degrees of price elasticity of supply. Use diagrams.
From the following information about an economy, calculate (1) its equilibrium level of national income (2) savings at equilibrium level of national income.

Consumption function: C = 200 + 0.9 Y

(where C = consumption expenditure and Y = national income)

Investment expenditure: I = 3000.

On the basis of consumption function C = 100 + 0.75Y, answer the following questions:
  1. Derive the saving function.
  2. Determine the saving at the income level of ₹ 1000 crore.
  3. At what level of income, saving becomes zero?