Questions

4 Marks Question

Take a timed test

78 questions · self-marked practice — reveal the answer and mark yourself.

Question 14 Marks
Explain three properties of indifference curves.
Answer
The Three properties of IC are:

  1. An IC slope downwards from left to right:

It is because to consume more quantity of one good, some quantity of the other goods must be reduced because the utility level remains the same.

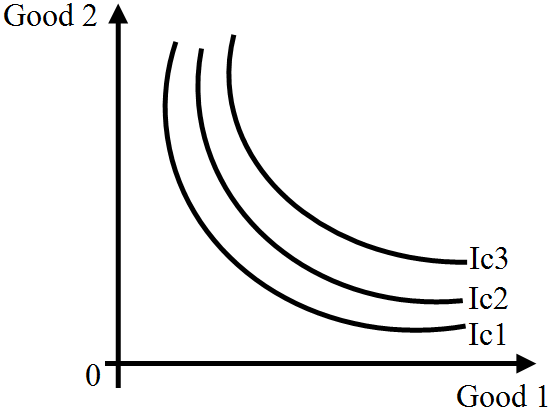
  1. An IC is convex towards origin:

It is because MRS declines as more is consumed of one good.

  1. An IC to the right represents higher level of satisfaction:

It is because an IC to the right shows more units of goods consumed and more units of goods consumed are assumed to have more utility.

View full question & answer
Question 24 Marks
A consumer consumes only two goods X and Y, both priced at Rs. 2 per unit. If the consumer chooses a combination of the two goods with Marginal Rate of Substitution equal to 2, is the consumer in equilibrium? Why or why not? What will a rational consumer do in this situation? Explain.
Answer
Given Px = 2, Py = 2 and MRS = 2, A consumer is said to be in equilibrium when,

$\text{MRS}=\frac{\text{P}_{x}}{\text{P}_{y}}$

Substituting the values we find that,

$2>\frac{2}{2}$

i.e. $\text{MRS}>\frac{\text{P}_{x}}{\text{P}_{y}}$

Therefore, consumer is not in equilibrium.

$\text{MRS}>\frac{\text{P}_{x}}{\text{P}_{y}}$ means that consumer is willing to pay more for one more unit of X as compared to what the market demands. The consumer will buy more and more of X. As a result MRS will fall due to the Law of Diminishing Marginal Utility. This will continue till $\text{MRS}=\frac{\text{P}_{x}}{\text{P}_{y}}$ and consumer is in equilibrium.

View full question & answer
Question 34 Marks
When the price of a good rises from ₹ 10 per unit to ₹ 12 per unit, its quantity demanded falls by 20 percent. Calculate its price elasticity of demand. How much would be the percentage change in its quantity demanded, if the price rises from ₹ 10 per unit to ₹ 13 per unit?
Answer
$\text{e}_\text{d}=\frac{\text{Percentage change in Quantity demanded}}{\text{Percentage change in price}}$

$=\frac{-20}{\frac{2}{10}\times{100}}=-1$

$-1=\frac{\text{Percentage change in quantity demanded}}{\text{Percentage change in price}}$

$=\frac{\text{percentage change in quantity demand}}{\frac{3}{10}\times100}$

${\text{Percentage change in quantity}}=-30\text{%}$

${\text {Demand falls by}}\text{ }30\text{%}$

View full question & answer
Question 44 Marks
A consumer consumes only two goods X and Y whose prices are Rs. 5 and Rs. 4 respectively. If the consumer chooses a combination of the two goods with marginal utility of X equal to 4 and that of Y equal to 5, is the consumer in equilibrium? Why or why not? What will a rational consumer do in this situation? Use utility analysis.
Answer
Given Px = 5 , Py = 4 and MUx = 4, MUy = 5, the consumer will be in equilibrium when,

$\frac{\text{MUx}}{\text{Px}}=\frac{\text{MUy}}{\text{Py}}$

Substituting values, we find that,

$\frac{4}{5}<\frac{5}{4}$ OR $\frac{\text{MUx}}{\text{Px}}<\frac{\text{MUy}}{\text{Py}}$

The consumer is not in equilibrium.

Since per rupee MUx is lower than per rupee MUy, the consumer will buy less of x and more of y. As a result due to Law of Diminishing Marginal Utility, MUx will rise and MUx will fall till.

$\frac{\text{MUx}}{\text{Px}}=\frac{\text{MUy}}{\text{Py}}.$

View full question & answer
Question 54 Marks
Explain why is an indifference curve (a) downward sloping and (b) convex.
Answer
  1. Indifference Curve Slopes Downwards: Because in order to consume More units of X good the consumer must give up some quantity of Y good, so that consumer remains on the same level of satisfaction at each point of Indifference Curve.
  2. Indifference Curve is convex to the origin: Because it is assumed that Marginal Rate of Substitution falls continuously as the consumer moves downwards along the curve. It is due to the Law of Diminishing Marginal Utility.
View full question & answer
Question 64 Marks
Explain the concept of ‘Marginal Rate of Substitution’ with the help of a numerical example. Also, explain its behaviour along an indifference curve.
Answer
Marginal Rate of Substitution (MRS) means the rate at which a consumer is willing to sacrifice quantity of one good to obtain one more unit of the other good.
Let the two goods consumed be A and B. Suppose the following combinations of these two goods have the same utility level for him:
Good A Good B MRS
1 8 -
2 4 4B:1A
3 1 3B:1A
The consumer is willing to sacrifice 4B to obtain second unit of A. For the third unit of A. he is willing to sacrifice less because marginal utility of A decreases as he consumes more of A.
View full question & answer
Question 74 Marks
Explain the distinction between "change in quantity supplied" and "change in supply". Use diagram.
Answer


Change in Quantity supplied' refers to change in supply due to own price of the good only. It means movement along the same supply curve. It is called extension when supply rises (from D to E) and contraction when supply fall (from F to E).
Change in supply' refers to change in supply due to factor other than the own price of the good like change in prices of inputs etc. This leads to shift of supply curve, It is called 'increase' when supply rises (from A to B) and 'decrease' when supply falls (from C to B).
View full question & answer
Question 84 Marks
Explain the difference between (i) inferior goods and normal goods and (ii) cardinal utility and ordinal utility. Give example in each case.
Answer
  1. Any good whose demand falls with rise in income is called an Inferior good.
Example: Suppose with rise in income a consumer buys less of X and instead buys more of Y then good X is inferior for that consumer.
Normal good is one whose demand rises with rise in income. Suppose with rise in income consumer buys more of X, then X is a normal good for that consumer.
  1. When utility can be expressed in exact units it is called Ordinal Utility.

Suppose a consumer says that he gets 2 units of utility from consumption of a good than it is Cardinal Utility. When utility is expressed in rank it is called Ordinal Utility. When a consumer says he gets less satisfaction from second unit as compared to the first unit, it is expression in terms of ordinal utility.

View full question & answer
Question 94 Marks
Explain the conditions of consumer's equilibrium with the help of the Indifference Curve Analysis.
Answer
Let the two goods be X and Y. Given income, prices and preferences of the consumer, the conditions of equilibrium are:
  1. MRS=Px/Py:

Explanation:

If MRS>Px/Py, the consumer will find it advantageous to substitute X for Y. As a result, MRS will fall. This process will continue till MRS becomes equal to Px/Py.

  1. MRSxy continuously falls:
In case the consumer is not in equilibrium, it is the decreasing MRS which brings back the consumer into equilibrium.
View full question & answer
Question 104 Marks
What are the conditions of consumer’s equilibrium under the indifference curve approach? What changes will take place if the conditions are not fulfilled to reach equilibrium?
Answer
There are two conditions:
  1. MRS = Ratio of prices.
  2. MRS continuously falls.
Explanation:
  1. Let the two goods be X and Y. The first condition for consumer’s equilibrium is that MRS = Px/Py. Now suppose, MRS is greater than Px/Py. It means that the consumer is willing to pay more for X than the price prevailing in the market. As a result, the consumer buys more of X. This leads to fall in MRS. MRS continues to fall till it becomes equal to the ratio of prices and the equilibrium is established.
  2. Unless MRS continuously falls, the equilibrium cannot be established.
View full question & answer
Question 114 Marks
Explain the effect of the following on the market demand of a commodity:
  1. Change in price of related goods.
  2. Change in the number of its buyers.
Answer
  1. Related goods are of two types:

Substitute goods and Complementary goods-

  1. Substitute goods: When the price of substitute goods rise/fall, they become dearer/cheaper than the given good. So the consumers will substitute given good for the other substitutes. (when price of substitute goods rise) The given good will be substituted by substitute goods. In this way, the demand for a good is affected by changes in price of substitute good.
  2. Complementary goods: When the price of complementary good falls, along with the rise in its demand, the demand for given good will also rise. When price of complementary good rises, along with a fall in its demand, the demand for given good will also fall.
  1. The larger the number of buyers of a commodity the more will be its market demand. The smaller the number of buyers of a commodity the lesser would be its market demand.
View full question & answer
Question 124 Marks
Explain the effect of the following on demand for a good:
  1. Rise in income.
  2. Rise in prices of related goods.
Answer
  1. Rise in income:
  • Normal good case:

Normal goods, for which the opposite is observed. Normal goods are those for which consumers' demand increases when their income increases.

  • Inferior good case:

An inferior good is a good whose quantity demanded decreases when consumer income rises (or quantity demanded rises when consumer income decreases).

  1. Rising in prices of related goods:
  • Substitute goods:

Substitute goods are goods that are similar enough in quality and function that one could be used to replace the other. Examples of substitute goods could be Coke and Pepsi, beef and chicken, Hondas and Toyotas. When the price for a good increases, then the demand for the substitute good will increase.

  • Complementary goods:

Complementary good Conversely, the demand for a good is decreased when the price of another good is increased. If goods A and B are complements, an increase in the price of A will result in a leftward movement along the demand curve of A and cause the demand curve for B to shift in; less of each good will be demanded.

View full question & answer
Question 134 Marks
Define market demand. State the factors that affect it.
Answer
It is the total demand by all the buyers of a commodity at a given price and in given period of time. Determinants of market demand:-
  1. Price of the commodity.
  2. Income of its buyers.
  3. Prices of related goods.
  4. Tastes of the buyers.
  5. Number of buyers of the commodity.
View full question & answer
Question 144 Marks
State and explain three properties of indifference curves.
Answer
Properties of indifference curves (ICs):

  1. Indifference curves slope downwards or negative slope:

The indifference curves slope downwards, left to right, because an increase in the amount of Good X along the indifference curve is associated with a decrease in the amount of Good Y, as the preferences are monotonic.

  1. Slope of indifference curves represents marginal rate of substitution:

Marginal rate of substitution (MRS) is the rate at which a consumer is willing to substitute one commodity for another commodity.

Slope of indifference curve between A and B $=\frac{\Delta\text{Y}}{\Delta\text{X}}=\text{MRS}$

MRS is the rate at which the output of Good Y is sacrificed for every additional unit of Good X.

  1. In an indifference map, higher IC represents higher level of satisfaction:

An indifference map refers to a set of indifference curves. An indifference curve which is to the right and above another shows a higher level of satisfaction to the consumer. Here, IC3 shows higher level of satisfaction than IC2. Thus, the indifference curve relates to a higher level of income of the consumer.

View full question & answer
Question 154 Marks
When the price of X doubles, its quantity demanded falls by 60 percent. Calculate its price elasticity of demand. What should be the percentage change in price so that its quantity demanded doubles?
Answer
$\text{E}_\text{d}=\frac{\text{%}{\text{Change in Qty}}}{\text %{\text{Change in price}}}$

$=\frac{-60\text{%}}{.100}$

$=0.6$

$-0.6=\frac{100\text{%}}{\text{%}{\text{Change in P}}}$

${\text %{\text{Change in P}}}=\frac{\text{100%}}{-0.6}$

= -166.67

View full question & answer
Question 164 Marks
Due to 10 percent fall in the price of X, its demand rises from 100 units to 120 units. How much percentage will its demand fall due to 10 percent rise in its price?
Answer
$\text{e}_\text{d}=\frac{\text{%}{\text{Change in Qty}}}{\text %{\text{Change in price}}}$

$\frac{\frac{-20}{100}\times100}{-10}$

$=\frac{20}{-10}=-2$

$-2=\frac{\text{Change in Q}}{10}$

$\Delta{\text{Q}}=-20$

Demand falls by 20%

View full question & answer
Question 174 Marks
When the price of commodity A falls from ₹ 10 to ₹ 5 per unit, its quantity demanded doubles. Calculate its elasticity of demand. At what price will its quantity demanded fall by 50 percent?
Answer
$\text{e}_\text{d}=\frac{\text{%}{\text{Change in Quantity demanded }}}{\text %{\text{Change in price}}}$

$=\frac{100}{\frac{-5}{10}\times100}$

$=\frac{100}{-50}$

$-2=\frac{-50}{\text %{\text{Change in price}}}$

${\text %{\text{Change in price}}}=\frac{-50}{-2}=25\text{%}$

$\text{Price}=10+10\times\frac{25}{100}=12.5$

View full question & answer
Question 184 Marks
When price of a commodity X falls by 10 per cent, its demand rises from 150 units to 180 units. Calculate its price elasticity of demand. How much should be the percentage fall in its price so that its demand rises from 150 to 210 units?
Answer
$ {\text{e}}_{\text{d}}= \frac{\text{% change in quantity demanded}}{\text % \text{ change in price}}$

$=\frac{\frac{30}{150}\times{100}}{-10}$

$​=\left(-\right)2$

$​=\left(-\right)2=\frac{\frac{60}{150}\times{100}}{\text % \text{ change in price}}$

${\text % \text{ change in price}}= \frac{60}{150}\times100\times{\frac{1}{-2}}$

$​=\left(-\right)20{\text%}$

View full question & answer
Question 194 Marks
Explain the conditions of consumer’s equilibrium using indifference curve analysis.
Answer
Given that two goods are X and Y, the two conditions are:
  1. $\text{MRS}=\frac{\text{Px}}{\text{Py}}.$
  2. MRS declines as more of a commodity X is consumed.
Explanation:
  1. Suppose $\text{MRS}>\frac{\text{Px}}{\text{Py}}$  It means that consumer is willing to pay more for an extra unit of X as compared to what market price is, The consumer consumes more and more of good X and less of good Y till MRS falls enough to be equal to the ratio finances and the consumer is in equilibrium.
  2. Unless MRS declines continuously as more and more of good X is consumed, it will not be equal to $\frac{\text{Px}}{\text{Py}}$ and consumer will not be able to reach the equilibrium.
View full question & answer
Question 204 Marks
A consumer consumes only two goods X and Y whose prices are Rs. 4 and Rs. 5 per unit respectively. If the consumer chooses a combination of the two goods with marginal utility of X equal to 5 and that of Y equal to 4, is the consumer in equilibrium? Give reasons. What will a rational consumer do in this situation? Use utility analysis.
Answer
Given Px = 4 , Py = 5 and MUx = 5 , MUy = 4,a consumer will be in equilibrium when,

$\frac{\text{MU}_{x}}{\text{P}_{x}}\text{ and } \frac{\text{MU}_{y}}{\text{P}_{y}}$

Substituting values, we find that,

$\frac{5}{4}>\frac{4}{5}\text{ OR }​​\frac{\text{MU}_{x}}{\text{P}_{x}}>\frac{\text{MU}_{y}}{\text{P}_{y}}$

Since per rupee MUis higher than per rupee MUy , consumer is not in equilibrium.

The consumer will buy more of X and less of Y. As a result MUx will fall and MUy will rise. The reaction will continue till $\frac{\text{MU}_{x}}{\text{P}_{x}}\text{ and } \frac{\text{MU}_{y}}{\text{P}_{y}}$   are equal and consumer is in equilibrium.

View full question & answer
Question 214 Marks
A consumer consumes only two goods X and Y both priced at Rs. 3 per unit. If the consumer chooses a combination of these two goods with Marginal Rate of Substitution equal to 3, is the consumer in equilibrium? Give reasons. What will a rational consumer do in this situation? Explain.
Answer
Given Px = 3, Py = 3 and MRS = 3, A consumer is said to be in equilibrium when,

MRS $=\frac{P_x}{P_y}$

Substituting values we find that,

$\text{3}>\frac{3}{3}$

i.e. MRS $=\frac{P_x}{P_y}$

Therefore consumer is not in equilibrium.

MRS >$\frac{P_x}{P_y}$ means that consumer is willing to pay more for one more unit of X as compared to what market demands.

  • The consumer will buy more units of X.
  • As a result MRS will fall due to the Law of Diminishing Marginal Utility.
  • This will continue till MRS $=\frac{P_x}{P_y}$ and consumer is in equilibrium.
View full question & answer
Question 224 Marks
Explain the relationship between:
  1. Prices of other goods and demand for the given good.
  2. Income of the buyers and demand for a good.
Answer
  1. Other goods are of two types: Substitutes and Complements. When price of a substitute good falls, the given good becomes relatively dearer. As a result its demand falls.

When price of a complementary good falls (rises) the demand for the complementary good rises (falls) and so the demand for the given good rises (falls) because both the goods are used jointly.

  1. When the consumer treats a good as a normal good, rise (fall) in income leads to rise (fall) in its demand.

When the consumer treats a good as an inferior good, rise (fall) in income leads to falls (rise) in its demand.

View full question & answer
Question 234 Marks
Explain consumer’s equilibrium with the help of Indifference Curve Analysis.
Answer
There are two conditions:

  1. MRS = Ratio of prices.
  2. MRS continuously falls.
Explanation:

  1. Let the two goods be X and Y. The first condition for consumer's equilibrium is that MRS = Px/Py. Now suppose MRS is greater than Px/Py. It means that the consumer is willing to pay more for X than the price prevailing in the market. As a result the consumer buys more of X. This leads to fall in MRS. MRS continues to fall till it becomes equal to the ratio of prices and the equilibrium is established.

(Or, alternatively in terms of when MRS < Px/Py).

  1. Unless MRS continuously falls, the equilibrium cannot be established.
View full question & answer
Question 244 Marks
Explain the conditions of a producer's equilibrium in terms of marginal cost and marginal revenue. Use diagram.
Answer
There are two conditions of producer's equilibrium:

  1. MC=MR.
  2. MC is greater than MR after equilibrium.

The conditions are fulfilled at point E in the diagram:

Explanation:

  1. So long as MC is less than MR, it is profitable for the producer to go on producing more because it adds to its profits. He stops producing more when MC becomes equal to MR.
  2. When MC is greater than MR after equilibrium it means producing more will lead to decline in profits.
View full question & answer
Question 254 Marks
Explain how do the following influence demand for a good:
  1. Rise in income of the consumer.
  2. Fall in prices of the related goods.
Answer
  1. When a consumer treats a good a normal good, rise in income leads to rise in its demand.

For example, if consumer treats good X as a normal good he is expected to demand more of X with rise in income.

When a consumer treats a good an inferior good, rise in income leads to fall in its demand.

For example, if consumer treats good Y an inferior good, he demands less of Y with rise in income.

  1. Fall in the price of substitute good, leads to fall in demand of the given good because the relative price of the given good rises.

For example: fall in the price of coffee may lead to fall in demand for tea because relative price of tea rises.

Fall in price of the complementry good raises the demand for the given good.

For example: fall in the price of petrol may lead to rise in demand for cars.

View full question & answer
Question 264 Marks
What is meant by producer's equilibrium? Explain the conditions of producer's equilibrium through the 'total revenue and total cost' approach. Use diagram.
Answer
Producer’s equilibrium refers to that level of output at which a producer gets maximum profits.

Conditions:

  1. TR-TC should be maximum because TR-TC equal profits. This condition is satisfied where the vertical distance between the TR curve and the TC curve is maximum. (i.e. AB)
  2. Profits falls when one more unit of output is produced beyond the output level where TR-TC is maximum. Or addition to total revenue is less than addition to total cost as more output is produced.
View full question & answer
Question 274 Marks
Using indifference curves approach, explain the conditions of consumer’s equilibrium.
Answer
There are two conditions:
  1. MRS = Ratio of prices.
  2. MRS continuously falls.
Explanation:
  1. Let the two-goods be X and Y. The first condition for consumer’s equilibrium is that MRS = Px/Py. Now suppose MRS is greater than Px/Py. It means that the consumer is willing to pay more for X than the price prevailing in the market. As a result the consumer buys more of X. This leads to fall in MRS. MRS continues to fall till it becomes equal to the ratio of prices and the equilibrium is established.
  2. Unless MRS continuously falls, the equilibrium cannot be established.
View full question & answer
Question 284 Marks
Explain the conditions of consumer’s equilibrium in case of (1) single commodity (2) two commodities. Use utility approach.
Answer
  1. ​​​Single commodity

The condition is MU = P.

So long as MU is greater then P, the consumer goes on buying because benefit is greater than cost. As he buys more MU falls because of the operation of the law of diminishing marginal utility. When MU = P, consumer gets the maximum benefits and is in equilibrium.

  1. Two commodities

The conditions:

  1.  $\frac{\text{M.U}_1}{\text{P}_1} =\frac{\text{M.U}_2}{\text{P}_2}$
  2. Law of diminishing marginal utility is operating.

The ratio MU/P is the rupee M.U. Suppose $\frac{\text{M.U}_1}{\text{P}_1} > \frac{\text{M.U}_2}{\text{P}_2}$

The consumer gets more per rupee MU from commodity 1 as compared to commodity 2. As a result, the consumer will divert expenditure from commodity 2 to commodity 1. This will lead to fall in MU1 and rise in MU2.

This will continue till $\frac{\text{MU}_1}{\text{P}_1}$ becomes equal to $\frac{\text{MU}_2}{\text{P}_2}$

Operation of the law of diminishing marginal utility is responsible for bringing the equality.

View full question & answer
Question 294 Marks
Explain the causes of a rightward shift in demand curve of a commodity of an individual consumer.
Answer
Causes of a rightward shift in demand curve:

Increase in income (Normal Good): When income increases, buyer of the commodity can buy more at same price. This causes a rightward shift in demand curve.

Rise in price of substitutes: When price of substitutes rises the given commodity becomes relatively cheaper than its substitutes. So it is purchased in place of its substitutes. Hence demand for commodity increase, resulting in right ward shift in demand curve.

Fall in price of complimentary good: When price of complementary good falls, its demand rises, this will also result in increase in demand for the given good as the two are complementary.

Favourable change in taste for the good: Favourable change in taste for good will result in more demand of it at the same price. Existing buyer of it may buy more of it.

View full question & answer
Question 304 Marks
A consumer consumes only two goods. Explain his equilibrium with the help of utility approach.
Answer
Equilibrium Condition: Ratio of MU to price is same in case of both goods.

$\frac{\text{MU}_{X}}{\text{P}_{X}}=$ $\frac{\text{MU}_{Y}}{\text{P} _Y}$

Explanation: Explain what happens if this condition is not satisfied and how the equilibrium is restored.

View full question & answer
Question 314 Marks
State three causes each for a rightward shift and a leftward shift of demand curve.
Answer
Causes for a rightward shift of demand curve:

  1. Increase in income of buyers. (normal good)
  2. Increase in price of a substitute good.
  3. Decrease in price of a complementary good.
  4. Favourable change in taste/fashion for the commodity.

Causes for a leftward shift of demand curve:

  1. Decrease in income of buyers. (normal good)
  2. Decrease in price of substitute good.
  3. Increase in price of complementary good.
  4. Unfavourable change in taste/fashion.
View full question & answer
Question 324 Marks
At a given price of a commodity, there is ‘excess demand’. Is this price an equilibrium price? If not, how will the equilibrium price be reached? (use diagram)
Answer
The price at which there is excess demand, can not be an equilibrium price because at equilibrium price the quantity demanded must be equal to the quantity supplied.

In the above diagram, the given price is shown as OP and at this price excess demand is equal to TR. This will result in competition among buyers causing a rise in price. A rise in price would result is upward movement along demand curve and supply curve as per the law of demand and law of supply. This is shown by arrows in the diagram. This reduces the excess demand. These changes will continue till the price rises to a level at which excess demand is whipped out. Such a price is OP1 at which quantity demanded and quantity supplied both are equal to OQ1.OP1 is the equilibrium price.

View full question & answer
Question 334 Marks
Suppose a consumer can buy 6 units of good 1 and 8 units of good 2 by spending his entire income. The prices of both the items are Rs 6 and Rs 8 respectively. Find out the following -
(i) Expenditure on item 1.
(ii) Expenditure on item 2.
(iii) Total income of the consumer.
(iv) Equation of the budget line.
Answer
(i) Expenditure on item 1 :
Expenditure is calculated as Price × Quantity.
Expenditure $1=P_1 \times x_1$
Expenditure $1=6 \times 6=$ Rs 36
(ii) Expenditure on item 2 :
Expenditure $2=P_2 \times x_2$
Expenditure $2=8 \times 8=$ Rs $6 4$
(iii) Total income of the consumer (M) :
Total income is the sum of expenditures on both goods since the consumer spends his entire income.
$M=\left(P_1 \times x_1\right)+\left(P_2 \times x_2\right)$
$M=36+64=$ Rs 100
(iv) Equation of the budget line :
The general equation for a budget line is $P_1 x_1+P_2 x_2=M$. By substituting the values :
$6 x_1+8 x_2=100$
View full question & answer
Question 344 Marks
At a price of Rs 4, there is a demand for 25 units of an article. If the price of an item increases to Rs 5, the demand decreases to 20 units. Calculate the price elasticity of demand. Explain the range of price elasticity of demand and on the basis of this classify goods into essential and luxury goods.
Answer
1. Numerical Calculation :
Initial Price (P1) Rs 4
New Price (P2) Rs $5 \rightarrow$ Change in Price $(\Delta P)$ : 5 - 4 = 1
Initial Quantity (Q1) 25 units
New Quantity (Q2) 20 units -> Change in Quantity $(\Delta Q)$ 20 - 25 = - 5
Formula for Price Elasticity of Demand (ed) :
$e_d=\left(\frac{\Delta Q}{\Delta P}\right) \times\left(\frac{P}{Q}\right)$
$e_d=\left(\frac{-5}{1}\right) \times\left(\frac{4}{25}\right)=\frac{-20}{25}=(-0.8$)
(The negative sign indicates the inverse relationship between price and demand. In absolute terms, $\left.\left|e_d\right|=0.8\right)$.
2. Range/Degree of Price Elasticity :
Since $\left|e_d\right|<1$, the demand is Relatively Inelastic (less than unit elastic). This means the percentage change in quantity demanded is less than the percentage change in price.
3. Classification of Goods :
Essential Goods : Generally have inelastic demand ( $e_d<1$ ) because consumers cannot easily reduce their consumption even if the price increases (e.g., salt, medicine, food grains).
Luxury Goods : Generally have elastic demand $\left(e_d>1\right)$ because consumers can postpone or skip their purchase if prices rise (e.g., AC, expensive cars).
Conclusion for this case : Based on the calculated value ( 0.8 ), this article falls into the category of Essential Goods.
View full question & answer
Question 354 Marks
When the price of a good X is ₹ 5, the consumer buys 100 units of the good X. At what price would he be willing to purchase 140 units of good X? The price elasticity of demand for good X is 2.
Answer
Original Quantity (Q) = 100 units
Original Price (P) = ₹ 5
New Quantity (Q1) = 140 units
New Price (P1) = ?
Change in Quantity $(\Delta \text{Q})$ = 40 units
Change in Price $(\Delta\text{P})$ = ?
Elasticity of demand(ED) = 2

Price Elasticity of demand (ED) $\text{PED}=\frac{\Delta\text{Q}}{\Delta\text{P}}\times\frac{\text{P}}{\text{Q}}$

$2=\frac{40}{\Delta\text{P}}\times\frac{5}{100}=\Delta\text{P}=₹ 1$

As the quantity demanded is increasing, price will decrease. It means that

New Price = Original Price (P) - Change in Price $(\Delta \text{P}) = 5 - 1 = \ ₹\ 4$

New Price = ₹ 4

View full question & answer
Question 364 Marks
When price of a commodity X falls by 10 percent, its demand rises from 150 units to 180 units. Calculate its price elasticity of demand. How much should be the percentage fall in its price so that demand rises from 150 to 210 units?
Answer
Original Quantity (Q) = 150 units
% Change in Price = -10%
Change in Quantity $(\Delta \text{Q})=30\text{ units}$
Elasticity of Demand (Ed) = ?
New Quantity (Q1) = 180 units

Percentage change in demand $=\frac{\Delta \text{Q}}{\text{Q}}\times100$

$=\frac{30}{150}\times100=20\%$

Price Elasticity of Demand (Ed$=\frac{\%\text{Change in quantity demanded}}{\%\text{Change in price}}=\frac{20\%}{-10\%}$

Price Elasticity of Demand (Ed) = (-)2

Ed = (-)2; Demand is elastic because Ed = 2.

Original qty (Q) = ₹ 150
% Change in price =?
New qty (Q1) = 210
Elasticity of Demand (Ed) = -1.25
Change in qty $(\Delta\text{Q})=60$

Percentage change in demand $=\frac{\Delta\text{Q}}{\text{Q}}\times100$

$=\frac{60}{150}\times100=40\%$

Price Elasticity of Demand (Ed$=\frac{\%\text{Change in quantity demanded}}{\%\text{Change in price}}-2$

$=\frac{40\%}{\% \text{Change in price}}\%\text{Change in price}=20\%$

View full question & answer
Question 374 Marks
When does a demand curve take the shape of a rectangular hyperbola?
Answer
If the equation of a demand curve takes the form pq = e, where e is constant, irrespective of the values of p and q, then the demand curve that we get is a rectangular hyper- bola, implying that on each and every point on the curve, the area underlying is the same. In the graph depicted above, point Q on the demand curve corresponds to area enclosed by rectangle OPOR which is 12 units [OP × OR = 4 × 3] Also, point T on the demand curve corresponds to area enclosed by rectangle OSTU which is again 12 units (OS× OU = 3 × 4). Therefore, demand curve DD is a rectangular hyperbola.

View full question & answer
Question 384 Marks
What are monotonic preferences? Explain why is an indifference curve:
  1. Downward sloping from left to right and
  2. Convex to the origin.
Answer
Monotonic preference means that as consumption increases, total utility also increases alongwith:

  1. Indifference curve slopes downwards from left to right because whenever a consumer wants to have more units of one commodity he will have to sacrifice some units of the other commodity. If the consumer can have more of both the commodities, his level of satisfaction will change which is not possible. Thus, there exists a negative relationship between quantity of X and quantity of Y.
  2. Indifference curve is convex to origin due to diminishing marginal rate of substitution. Marginal S rate of substitution of X for Y refers to the number of units of good Y that the consumer is willing to forego for an additional unit of good X, so as to maintain the same level of satisfaction.

$\text{MRS}=\frac{\Delta\text{Y}}{\Delta\text{X}}.$

View full question & answer
Question 394 Marks
The price elasticity of demand of good X is half the price elasticity of demand of Good Y. A 25% rise in the price of good Y reduces its demand from 400 units to 300 units. Calculate percentage rise in demand of good X when its price falls from ₹ 10 to ₹ 8 per unit.
Answer
In the given example first we will calculate Price Elasticity of Good Y

Original Quantity (Q) = 400 units
% Change in Price = 25%
New Quantity (Q1) = 300 units
Elasticity of Demand (ED) = ?
Change in Quantity $(\Delta\text{Q})=100\text{ units}$


Percentage change in demand $=\frac{\Delta \text{Q}}{\text{Q}}\times100$

$=\frac{-100}{400}\times100=-25\%$

Price Elasticity of Demand (ED) $=\frac{\%\text{Change in quantity demanded}}{\%\text{Change in price}}=\frac{-25\%}{25\%}$

Price Elasticity of Demand (ED) = (-)1

Now, Price Elasticity of Good X = 6 0.5 (as elasticity of demand of good X is half the price elasticity of demand of Good Y).

Let us now calculate % rise in Demand for X

Original Price (P) = ₹ 10
% Rise in Quantity =?
New Price (P1) = ₹ 8
Elasticity of Demand (ED) = (-) 0.5
Change in Price $\Delta \text{P} = - \ ₹\ 2$
 
Percentage change in Price $=\frac{\Delta \text{P}}{\text{P}}\times100$

$=\frac{-2}{10}\times100=-20\%$

$(-)0.5=\frac{\%\text{Change in quantity demanded}}{-20}$

Demand for Good X will rise by 10%

View full question & answer
Question 404 Marks
The demand for goods X and Y have equal price elasticity. The demand of good X rises from 100 units to 250 units due to a 20 percent fall in its price. Calculate the percentage rise in demand of Y if its price falls by 8 percent.
Answer
In the given example, first we will calculate Price Elasticity of Good X.

Original Quantity (Q) = 100 units
% Change in Price = -20%
New Quantity (Q1) = 250 units
Elasticity of Demand (ED) = ?
Change in Quantity (DQ) = 150 units
 
Percentage change in demand $=\frac{\Delta\text{Q}}{\text{Q}}\times100$

$\frac{150}{100}\times100=150\%$

Price Elasticity of Demand (ED) $=\frac{\%\text{Change in quantity demanded}}{\%\text{Change in price}}=\frac{150\%}{-20\%}$

Price Elasticity of Demand (ED) = (-)7.5

Now, Price Elasticity of Good Y = 0 7.5 (as both X and Y have same price elasticity). Let us now calculate % Rise in Demand for good Y.

% Rise in Demand = ?

% Change in Price = - 8%

Elasticity of Demand (ED) = (-)7.5

Price Elasticity of Demand (ED) $=\frac{\%\text{Change in quantity demanded}}{\%\text{Change in price}}$

$(-)7.5=\frac{\%\text{Change in quantity demanded}}{-8\%}$

Percentage rise in demand = 60%

Demand for Good Y will rise by 60%

View full question & answer
Question 414 Marks
Suppose there are three consumers in a particular market: Ashok, Mohan and Jay. Their demand schedules are given in the following table:
Price
Quantity Demanded by Ashok
Quantity Demanded by Mohan
Quantity Demanded by Jay
1
60
55
24
2
50
40
13
3
40
25
5
4
30
10
0
5
20
0
0
  1. Derive the market demand schedule.
  2. Suppose Mohan drops out of the market. Derive the new market demand schedule.
  3. Suppose Mohan stays in the market and another person, Bhim, joins the market, whose quantity demanded at any given price is half of that of Ashok. Derive the new market demand schedule.
Answer
  1. Market Demand Schedule:
PX
DA
DM
DJ
MD
1
60
55
24
139
2
50
40
13
103
3
40
25
5
70
4
30
10
0
40
5
20
0
0
20
  1. When Mohan drops, new market demand schedule is given as:
Price
Market Demand
1
60 + 24 = 84
2
50 + 13 = 63
3
40 + 5 = 45
4
30 + 0 = 30
5
20 + 0 = 20
  1. New MD schedule with Bhim joining:
Price (₹)
Market Demand {DA + DM + DJ} + DB 
1
139 + 30 = 169
2
103 + 25 = 128
3
70 + 20 = 90
4
40 + 15 = 55
5
20 + 10 = 30
View full question & answer
Question 424 Marks
Show diagrammatically the conditions for consumer's equilibrium, in Hicksian analysis of demand.
Answer
As per the Hicksian analysis, the given consumer attains equilibrium when the two conditions are fulfilled.

  1. MRS = MRE = $\frac{\text{P}_\text{X}}{\text{P}_\text{Y}}.$

Slope of Indifference curve = Slope of the Budget line

  1. MRS falls as more is consumed of one good at the cost of another. Showing the condition of equilibrium diagrammatically. The given budget line AB is tangential to the indifference curve I, at point X in the given diagram. This is the point of consumer's equilibrium. The utility maximizing combination of the two goods is OQ of good X and OP of good Y.

View full question & answer
Question 434 Marks
On the basis of the following schedule, calculate Price Elasticity of Demand by percentage method.
Price per unit (₹)
Total expenditure (₹)
10
180
9
162
Answer
Price per unit (₹)
Total expenditure (₹)
Quantity demande $\Big(\frac{\text{TE}}{ \text{P}}\Big) $ (units)
10
180
[180 ÷ 10] 18
9
162
[162 ÷ 9] 18

$\Delta \text{P}=9-10=-1,$

$\Delta \text{Q}=18-18=0$

Percentage Change in Quantity Demanded $=\frac{\Delta \text{Q}}{\text{Q}}\times100$

$=\frac{0}{18}\times100=0$

Percentage Change in Price $=\frac{\Delta \text{P}}{\text{P}}\times100$

$=\frac{1}{10}\times100=\ ₹\ 10$

$\text{E}_\text{d}= \frac{\text{Percentage Change in Quantity Demanded}}{\text{Percentage Change in Price }}$

$=\frac{0}{10}=0$

Ed = 0 (perfectly inelastic demand)

View full question & answer
Question 444 Marks
Giving reasons, which of the following commodities have elastic, moderately elastic, highly elastic or inelastic demand?
  1. Salt.
  2. Particular brand of lipstick.
  3. Medicines.
  4. Mobile phone.
  5. Demand for textbooks demand for milk.
Answer
  1. Salt has inelastic demand. This is a necessity and a consumer has to buy salt even though its price changes.

  2. A particular brand of lipstick has inelastic demand: because the given consumer may have a preference for it.

  3. Medicines have inelastic demand: The reason being that a consumer has to buy these even though the price of these may change, as they are essential.

  4. Demand for mobile phone is elastic: The reason being when price of mobile phone goes up, the consumer will postpone its use and demand for it will fall.

  5. Demand for textbooks is completely inelastic: The reason being that a student will purchase the textbooks irrespective of price. So, in case of textbooks, even a substantial change in price leaves the demand unaffected.

  6. Demand for milk is elastic: The reason being that when the price of the milk increases substantially the consumers purchase less quantity of milk.

View full question & answer
Question 454 Marks
For a consumer to be in equilibrium why must marginal rate of substitution be equal to the ratio of prices of the two goods?

OR 

Using indifference curve approach, explain the conditions of consumer's equilibrium.

OR

Why is the consumer in equilibrium when he buys only that combination of the two goods that is shown at the point of tangency of the budget line with an indifference curve? Explain.

OR

What are the conditions of consumer's equilibrium under the indifference curve approach? What changes will take place if the conditions are not fulfilled to reach equilibrium?

OR

State and explain the conditions of consumer's equilibrium in indifference curve analysis.

OR

Explain consumer equilibrium using the concept of budget line and indifference map or Interior Optimum Consumer Equilibrium.

OR

A consumer consumes only two of goods. For the consumer to be in equilibrium why must Marginal Rate of Substitution between the two goods must be equal to the ratio of prices of these two goods? Is it enough to ensure equilibrium?

OR

A consumer consumes only two goods. Explain the conditions that need to be satisfied for the consumer to be in equilibrium under indifference curve analysis.

OR

Show diagrammatically the conditions for consumer's equilibrium, in Hicksian analysis of demand.

OR

Explain the conditions of consumer's equilibrium under indifference curve approach.

Answer
  1. To define consumer equilibrium, we use Indifference Curve map and the budget line.

Two Conditions for Consumer Equilibrium:

  1. Necessary Condition:

Marginal Rate of Substitution = Market Rate of Exchange $\Big[\frac{\text{P}_\text{x}}{\text{P}_\text{y}}\Big]$

$\text{MRS}_\text{x y}=\frac{\text{P}_\text{x}}{\text{P}_\text{y}}$

(Market Rate of Exchange) $\Big[\frac{\text{P}_\text{x}}{\text{P}_\text{y}}\Big]$

$\text{MRS}_\text{ x,y}=\frac{\text{P}_\text{x}}{\text{P}_\text{y}}$

(Market Rate of Exchange)MRE

$\text{MRS}_\text{ x,y}=\text{MRE} \Big[ \frac{\text{P}_\text{x}}{\text{P}_\text{y}}\Big]$

If $\text{MRS}_\text{ x,y}>\text{MRE} \Big[\frac{\text{P}_\text{x}}{\text{P}_\text{y}}\Big]$

  • It means that to obtain one more unit of X, the consumer is willing to sacrifice more unit of Y as compared to what is required in the market.
  • In other words, conusmer's willingness to pay for commodity X is higher than what market values for commodity X.
  • This induces the consumer to buy more of X and less of Y, which result in fall in MRS till it become equal to price.
  1. If $\text{MRS}_\text{ x,y}<\text{MRE}\Big[\frac{\text{P}_\text{x}}{\text{P}\text{y}}\Big]$
  1. It means that to obtain one more unit of X, the consumer is willing to sacrifice less unit of Y as compared to what is required in the market.
  2. In other words, conusmer's willingness to pay for commodity X is lower than what market values for commodity X.
  3. This induces the consumer to buy less of X and more of Y, which result in rise in MRS till it become equal to price.

  1. Sufficient Condition: MRSx, y Diminishing (Convex) at a point of equibrium i.e., when,

$\text{MRS}_\text{ x,y}=\text{MRE}\Big[\frac{\text{P}_\text{x}}{\text{P}_\text{y}}\Big]$

  1. The consumer will reach equilibrium when the budget line is tangential to the higher possible Indifference Curve, i.e., where necessary and sufficient conditions satisfy. In the above diagram, the consumer will reach equilibrium at point E where budget line RS is tangentialto the highest possible IC2 .
  2. The consumer cannot move to Indifference Curve, i.e., IC3, as this is beyond his money income.
  3. Even on IC,, all the other points except E are beyond his means.
  4. Hence, at point E, the consumer is in equilibrium where his satisfaction maximizes, given his income and prices of goods X and Y. In equilibrium at E, the slope of Budget line = the slope of Indifference Curve. Therefore, MRS is equal to the ratio of the prices of two goods $\Big[\frac{\text{P}_\text{x}}{\text{P}_\text{y}}\Big]$
View full question & answer
Question 464 Marks
Explain with the help of diagram the effect of the following on the demand of a commodity.
  1. Fall in the price of a complementary good.
  2. Rise in the income of its buyer.
Answer
  1. The demand of a commodity and the price of its complementary good are inversely related to each other. Suppose car and petrol are complementary goods. A fall in the price of complementary good (say petrol) not only increases the demand for petrol but the demand for car also increases. The demand curve of the commodity shifts to the right. The given diagram shows the effect.

In the given diagram, the demand curve of the commodity (say car) is shown by DD curve. It shifts rightwards to D1D1 because with the fall in the price of complementary good (say petrol), the demand of the commodity (car) rises from OQ to OQ, at the same price OP.

  1. The effect of increase in income of the consumer on demand of a commodity depends on the nature of the commodity. A rise in the income of the buyer will lead to a rise in demand for the commodity (normal commodity) as buyer's purchasing capacity will increase. The demand curve of the commodity will shift to the right to D1D1. The given diagram shows the effect.

In the diagram, the demand curve of the commodity is shown by DD curve. With the rise in the income of its buyer, the demand of the commodity rises from OQ to OQ1 at the same price OP.

A rise in income of the buyer will lead to a fall in demand for the inferior commodity and the demand curve will shift to the left to D0D0 With the rise in income, the demand for the inferior commodity falls from OQ to OQ0 at the same price OP.

View full question & answer
Question 474 Marks
Explain with the help of diagram the effect of the following changes on the demand of a commodity.
  1. A rise in the price of a complementary good.
  2. A rise in the price of substitute good.
Answer
  1. The demand of a commodity and price of its complementary good are inversely related to each other. When the price of complementary good (say petrol) rises, not only its demand falls but the demand for the commodity (say car) also falls and as a result the demand curve of the commodity (car) shifts to the left. The given diagram shows the effect.

In the diagram, demand curve of X (say car) is shown by DD curve. With the rise in the price of complementary good (say petrol), the demand of good X falls from OQ to OQ, at the same price OP. The demand curve shifts leftward to D0D0.

  1. The demand of a commodity and price of its substitute good are directly related to each other. When the price of substitute good (say coffee) rises, its demand falls and the demand for the commodity (say tea) rises and as a result, the demand curve of the commodity (tea) shifts to the right. The given diagram shows the effect.

In the diagram, demand curve of X (say tea) is shown by DD curve. With the rise in the price of substitute good (say coffee), the quantity demanded of good X (tea) rises from OQ to OQ1 at the same price OP. The demand curve shifts rightward to D1D1.

View full question & answer
Question 484 Marks
Explain with the help of diagrams, the effect of the following changes on the demand of a commodity:
  1. A rise in price of Substitute good.
  2. A rise in price of Complementary good.
Answer
  1. A rise in price of Substitute good:

Increase in Price of Substitute Goods:

An increase in price of substitute goods (Coke) leads to an increase in demand of a given commodity (Pepsi). The Demand curve of Pepsi would shifts rightward It can be explained with the help of given diagram:

In the given diagram the demand curve for Pepsi when the price of Coke is *18 lies to the right of that when the price of Coke is * 15. Hence, an increase in the price of a substitute good shifts the demand curve for a product to the right.

  1. A rise in price of Complimentary good Increase in Price of Complimentary Good [Refill] leads to a decrease in demand of given commodity (Pen). The Demand curve for Pen shifts leftwards. It can be explained with the help of given diagram:

In the above diagram, the demand curve for Pen when Refill price is 5 lies to the left of that when the Refill price is * 3.

View full question & answer
Question 494 Marks
Explain with the help of diagrams, the effect of the following changes on the demand for a commodity:
  1. A fall in the price of substitute goods.
  2. A fall in the income of its buyer.
Answer
  1. Demand for a commodity will decrease when there is a fall in the price of substitute goods, implying that demand curve would shift backward. Less will be purchased at the same price. Demand for commodity falls from OQ to OQ1. So, fall in the price of tea will cause demand for coffee to fall. This situation is described in below figure.

The given figure illustrate this situation:

  1. Demand for a commodity will decrease when there is a fall in the income of the consumer (assuming that the commodity demanded is a normal good). This would imply a backward shift in demand curve. Less will be purchased at the same price. Demand for commodity falls from OQ to Q1. So, decrease in consumer's income will cause his demand for pure ghee to fall. This situation is described in above figure.
View full question & answer
Question 504 Marks
Explain with the help of a diagram the effect of the following changes on the demand of a commodity.
  1. A fall in the price of substitute good.
  2. A fall in the income of its buyer.
Answer
  1. The demand of a commodity and the price of it substitute goods are directly related to each other. Suppose tea and coffee are substitute goods to each other. When the price of substitute good (say coffee) falls, the demand for coffee rises but the demand of its related good (say tea) falls and as a result, the demand curve of the commodity (tea) shifts to the left. The given diagram shows the effect.

In the diagram, the demand curve of the commodity (say tea) is shown by DD curve. With the fall in the price of substitute good (say coffee) the demand for commodity (tea) falls at the same price OP. The demand curve shifts from DD to D0D0.

  1. The effect of fall in income of the consumer on demand of a commodity depends on the nature of the commodity. A fall in the income of its buyer will lead to decrease in demand for the commodity assuming it to be a normal good. As buyer's purchasing capacity will reduce. The demand curve of the commodity will shift to the left. The given diagram shows the effect.

In the diagram, the demand curve of the commodity is shown by DD curve. With the fall in the income of its buyer, the demand curve shifts leftwards to D0D0 and the demand of the commodity falls from OQ to OQ0 at the same price OP.

A fall in the income of the buyer will lead a rise in the demand for the inferior good. So, the demand curve will shift to the right from DD to D1D1. So, with the fall in income, the demand for inferior good increases from OQ to OQ1 at the same price OP.

View full question & answer
Question 514 Marks
Explain the Law of Demand with the help of diagram. State its exceptions.
Answer
The Law of Demand states that other things remaining constant, the quantity demanded of a commodity expands with fall in its price and contracts with a rise in its price.
So, there is an inverse relationship between price and quantity demanded of a commodity. This is explained with the help of an imaginary table and the curve which is based on imaginary data:
Demand schedule
Price per unit (₹)
Quantity demanded (units)
10
50
8
60
6
70
4
80
2
90

Exceptions to the Law The law will not hold good under following circumstances:
  1. Conspicuous Consumption: The Law of Demand will not apply in case of costly items such as diamonds. These commodities will be demanded, even if the prices are high..
  2. Conspicuous Necessities: Certain things become the necessity of modern life, so we have to purchase these goods inspite of their price. The demand of television sets and automobiles has not gone down inspite of the increase in their price.
  3. Ignorance: If the consumer is not aware of the competitive price of the commodity, he may purchase more of the commodity even at higher price. Such ignorance of the buyers makes the Law of Demand ineffective.
View full question & answer
Question 524 Marks
Explain the inverse relationship between price and quantity demanded of a commodity.

OR

Why is the demand curve of the commodity negatively sloped?

Answer
Downward slope of demand curve indicates that more is purchased in response to fall in price and vice-versa. Thus, there is inverse relationship between own price of a commodity and its quantity demanded.

This is attributed to the following factors:

  1. Law of Diminishing Marginal Utility: According to this law, as the consumption of a commodity increases, the utility from each successive unit goes on diminishing. Accordingly, for every additional unit to be purchased, the consumer is willing to pay less price.

  2. Income Effect: Change in the own price of a commodity causes a change in real income of the consumer. With a fall in price, real income increases. Accordingly, demand for the commodity expands and vice-versa.

  3. Substitution Effect: It refers to the substitution of one commodity for the other when it becomes relatively cheaper due to change in relative prices.

  4. Size of Consumer Group: When price of a commodity falls, it attracts new buyers who can now afford to buy it, hence quantity demanded rises.

  5. Different Uses: Many goods have alternative uses, e.g. milk is used for making curd, cheese and butter. If price of milk reduces, it will be put to different uses. Accordingly, demand for milk expands.

View full question & answer
Question 534 Marks
Explain the equilibrium of a consumer in case of two commodities with the help of utility analysis.

OR

How does a consumer reach equilibrium in case of two commodities under the cardinal utility theory?

Answer
Under the utility approach, a consumer attains equilibrium in case of two commodities when the consumer spends his income in such a way that the ratio of the marginal utility of a commodity to its price is equal to the ratio of the marginal utility of the other commodity to its price. Mathematically, the condition is expressed as:

  1. $\frac{\text{MU}_\text{X}}{\text{P}_\text{X}}=\frac{\text{MU}_\text{Y}}{\text{P}_\text{Y}}$
  2. MU should decrease with increase in consumption.
Example: Suppose a consumer's income is 30 which he wants to spend on two goods X and Y. The price of each unit of X and Y is 4 and ₹ 2. Marginal utility schedule of X and Y is given as:

Units

MUX

Where PX = ₹ 4 (given)

Where PY = ₹ 2 (given)

$\frac{\text{MU}_\text{Y}}{\text{P}_\text{Y}}$

$\frac{\text{MU}_\text{X}}{\text{P}_\text{X}}$

MUY

1

80

$\frac{80}{4}=20$

40

$\frac{40}{2}=20$

2

72

$\frac{72}{4}=18$

38

$\frac{38}{2}=19$

3

64

$\frac{64}{4}=16$

36

$\frac{36}{2}=18$

4

54

$\frac{56}{4}=14$

34

$\frac{34}{2}=17$

5

48

$\frac{48}{4}=12$

32

$\frac{32}{2}=16$

6

40

$\frac{32}{4}=8$

30

$\frac{30}{2}=15$

7

32

$\frac{32}{4}=8$

28

$\frac{28}{2}=14$

8

24

$\frac{24}{4}=6$

26

$\frac{26}{2}=13$

9

16

$\frac{16}{4}=4$

24

$\frac{24}{2}=12 $

10

8

$\frac{8}{4}=2$

22

$\frac{22}{2}=11$

It is evident from the table that in order to have maximum utility, consumer will purchase 4 units of X and 7 units of Y because this combination of goods satisfies the following two conditions:

At 4 units of X $$$=\frac{\text{MU}_\text{X}}{\text{P}_\text{X}}=\frac{56}{4}=14$

At 7units of Y $=\frac{\text{MU}_\text{Y}}{\text{P}_\text{Y}}=\frac{28}{2}=14$

$\frac{\text{MU}_\text{Y}}{\text{P}_\text{Y}}=\frac{\text{MU}_\text{X}}{\text{P}_\text{X}}$

Further, Expenditure on X + Expendicture on Y = Total Income

$\text{i.e., P}_\text{X}.\text{Q}_\text{X}+\text{P}_\text{Y}.\text{Q}_\text{Y}=\text{M}$

$4\times4+2\times7= ₹\ 30$

View full question & answer
Question 544 Marks
Explain the effect of the following on demand for a good:
  1. Fall in Income for Normal.
  2. Fall in Income for Inferior.
Answer
  1. Fall in Income for Normal Goods: In the above schedule, note that, as the income of a consumer falls from ₹ 6000 to ₹ 5000, the quantity demanded of normal goods decreases for any given price of normal goods. For example, the given income is 6000 and at price of normal goods is ₹ 150, the quantity demanded of normal goods is 25. Whereas the given income is 5000, at the same price of normal goods (i.e. 150), the quantity demanded of normal goods is 20. In the given diagram, the demand curve for normal goods, when income is 5000 lies to the left of that when income is 6000. Hence, an decrease in the income of a consumer shifts the demand curve for normal goods to the left.

  1. Fall in Income for Inferior Goods: In the above schedule, note that, as the income of a consumer decreases from ₹ 6000 to ₹ 5000, the quantity demanded of inferior goods increases for any given price of inferior goods. For example, the given income is ₹ 6000 and at price of inferior goods is ₹ 150, the quantity demanded of inferior goods is 18. Whereas the given income is ₹ 5000, at the same price of inferior goods (i.e. 150), the quantity demanded of inferior goods is 20.

In the above diagram the demand curve for inferior goods when income is ₹ 5000 lies to the right of that when income is ₹ 6000. Hence, a decrease in the income of a consumer shifts the demand curve for inferior goods to the right.

View full question & answer
Question 554 Marks
Explain the difference between decrease in demand and decrease in quantity demanded. Give two causes of decrease in demand.
Answer
Decrease in demand: Decrease in demand is due to change in factors other than price of the given good, e.g., decrease in income (normal good), unfavourable change in tastes etc.

Decrease in quantity demanded: Decrease in quantity demanded is due to rise in own price of the given commodity.

Two causes of decrease in demand are:

  1. Fall in the price of substitute goods: The demand for a good falls with the fall in the price of its substitute good. As a result, the demand curve for the commodity shifts to the left with the fall in the price of its substitute good.

$\text{P}_\text{Y}\downarrow\{\text{D}_\text{Y}\uparrow\}\text{D}_\text{X}\downarrow$

  1. Rise in the price of the complementary good: As a result, there is a decrease in the demand.

$\text{P}_\text{Y}\uparrow\{\text{D}_\text{Y}\downarrow\}\text{D}_\text{X}\uparrow$

View full question & answer
Question 564 Marks
Explain the conditions of consumer's equilibrium using indifference curve analysis.

OR

consumer consumes only two goods. Explain the conditions of consumer equilibrium with the help of indifference curve analysis. Use diagram.

OR

Explain the conditions of consumer equilibrium with the help of indifference curve analysis. Use diagram.

OR

Use indifference curve approach, explain the conditions of consumer's equilibrium.

OR

What are the conditions of consumer's equilibrium under indifference curve approach? What changes will take place if the conditions are not fulfilled to reach equilibrium?

Answer
Consumer equilibrium is defined as the level of consumption where the consumer derives maximum satisfaction from the consumption of commodities and does not have any desire to change from that level of consumption.

The consumer will continue to substitute Y for X as long as the marginal rate of substitution is greater than or equal to the price ratio of both the commodities.

The necessity of this condition can be explained with the help of the given diagram:

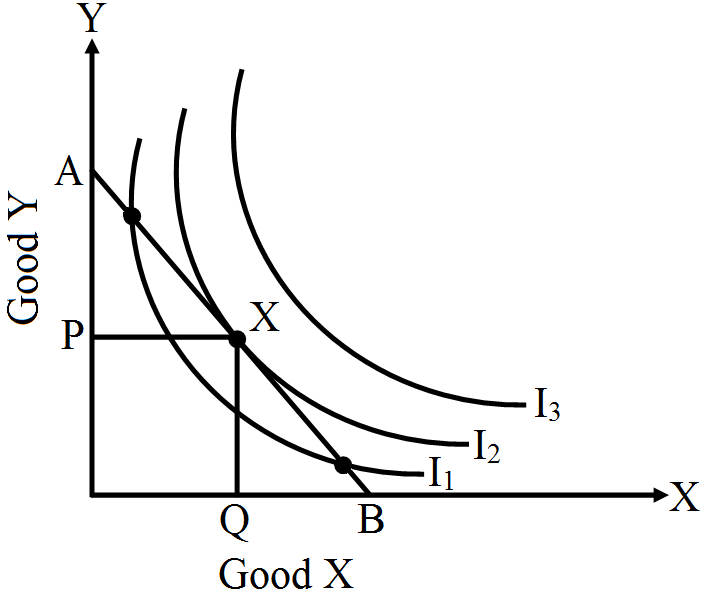
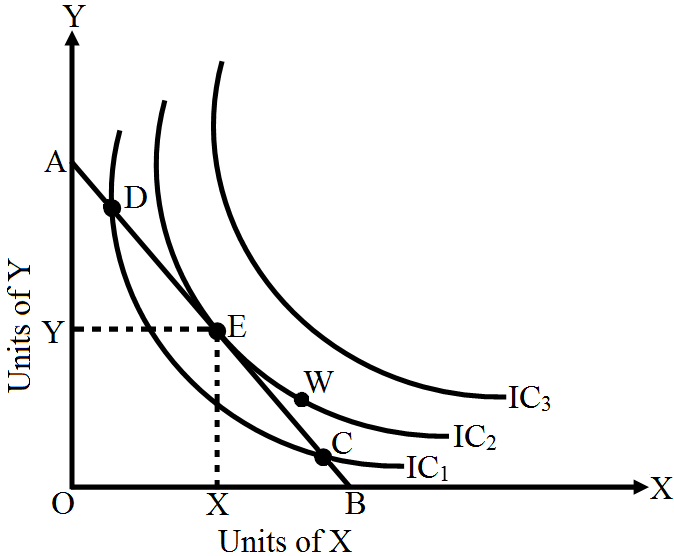
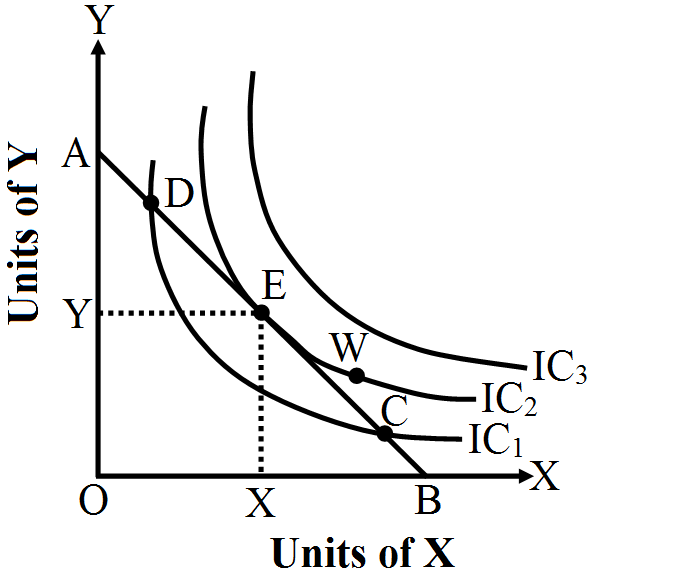
In the given diagram IC1, IC2, and IC3, represent the indifference map for the consumer representing the consumer's scale of preferences. AB represents the budget line which shows various combinations of the two commodities that a consumer can purchase from his given income and price of the commodities.

Consumer equilibrium is achieved at point E where the budget line is tangential to the indifference curve.

  1. If Marginal Rate of Substitution is greater than the price ratio or market rate of exchange: This is represented by point D in the given diagram. When the marginal rate of substitution is greater than the market rate of exchange then it would represent that the consumer is willing to sacrifice in a higher proportion as compared to the price ratio or market rate of exchange. Hence, the consumer becomes ready to consume more of X by sacrificing Y. Due to increase in consumption of X, the MRS between X and Y will fall. This process continues till the level where the marginal rate of substitution becomes equal to the market rate of exchange.
  2. Similarly, if MRS is less than the price ratio, then the consumer will become ready to consume less of X. Due to decrease in consumption of X, the MRS between X and Y will increase. This process continues till the level where MRS becomes equal to the market rate of exchange $\frac{\text{P}_\text{X}}{\text{P}_\text{Y}}.$

Hence, the consumer will be at equilibrium, i.e., the consumer's behaviour will be stable only if the marginal rate of substitution becomes equal to market rate of exchange.

No, the equality of MRS to price ratio or market rate of exchange is not enough to achieve equilibrium. The diminishing marginal rate of substitution or convexity of indifference curve is also a necessary condition to achieve equilibrium. In fact it is a necessary condition in order to achieve a unique equilibrium point for the consumer.

View full question & answer
Question 574 Marks
Explain the conditions of consumer's equilibrium under utility analysis.

OR

Explain the conditions of consumer's equilibrium using marginal utility analysis.

OR

A consumer consumes only two goods X and Y. Explain the conditions of consumer's equilibrium using utility analysis.

Answer
Assuming that the given consumer consumes only two goods X and Y. Further the income of the consumer and the prices of the two goods, are also assumed to be given. Now for the given consumer to be in equilibrium under the utility analysis two conditions must be fulfilled:

  1. MU of last unit of money (rupee) spent on each good is the same:

Let the two goods be X and Y, their prices be PX and PY and their MU's as MUX and MUY. The a day : equilibrium condition is:

$\frac{\text{MU}_\text{X}}{\text{P}_\text{X}}=\frac{\text{MU}_\text{Y}}{\text{P}_\text{Y}}=\text{MU}$ of the last unit of money (rupee) spent on each good.

In case $\frac{\text{MU}_\text{X}}{\text{P}_\text{X}}>\frac{\text{MU}_\text{Y}}{\text{P}_\text{Y}},$ thus implies that MU from the last rupee spent on X is greater than MU of the last rupee spent on Y. This will induce the given consumer to transfer expenditure from Y to X, i.e., consumption of X rises and Y's falls. As a result, MUX falls and MUY rises. This transfer of expenditure continues till $\frac{\text{MU}_\text{X}}{\text{P}_\text{X}}=\frac{\text{MU}_\text{Y}}{\text{P}_\text{Y}}$ and the given consumer gets the same MU per rupee.

  1. MU of a good falls as more of it is consumed:

MU of a good falls as more of it is consumed. This condition is nothing but the assumption that the Law of Diminishing Marginal Utility is in operation. Suppose $\frac{\text{MU}_\text{X}}{\text{P}_\text{X}}>\frac{\text{MU}_\text{Y}}{\text{P}_\text{Y}},$ the given consumer will continue to transfer expenditure from Y to X till expenditure on Y is reduced to zero, and the entire income of the given consumer is spent on X. This implies that the given consumer consumes only one good, which is highly unrealistic. As a matter of fact, he spends his income on many goods. Thus, for the fulfillment of the first condition, it is also necessary to that the law of Diminishing MU is in operation.

View full question & answer
Question 584 Marks
Explain the concepts of (a) Marginal rate of substitution, (b) Budget line equation with the help of an example.
Answer
  1. Marginal Rate of Substitution: MRS of X for Y refers to the number of units of good Y that the consumer is willing to forego for an additional unit of good X, so as to maintain the same level of satisfaction.

$\text{MRS}=\frac{\Delta\text{Y}}{\Delta\text{X}}$

The concept of MRS can be understood with the help of following table:

Combinations
Units of X (Shirts)
Units of Y (Trousers)
MRS
A
1
20
-
B
2
16
4Y :1 X
C
3
13
3Y : 1X
D
4
11
2Y : 1X
E
5
10
1Y : 1X

When consumer moves from combination A to B he sacrifices 4 units of trousers (Y) for an additional unit of shirt (X) to maintain the same level of satisfaction. Therefore, MRS at this stage is 4Y : 1X. When consumer moves from B to C, from C to D and from D to E, MRS diminishes as the consumer increases the units of shirts (X) and decreases the units of trouser (Y). In other words, he acquires constant quantity of shirts (X) (increase in X by 1 unit each time) and gives up a smaller and smaller quantity of trousers (Y).

  1. Suppose a consumer has ₹ 20 as his income and he spends on goods X and Y. Price of good X and good Y are ₹ 5 and ₹ 4 per unit respectively. If he decides to spend his entire money income of ₹ 20 on the purchase of good X (no purchase of good Y), then he can buy $\Big(\frac{\ ₹ \ 20}{\ ₹\ 5} \Big)$ 4 units of X. This is shown by point M in the figure given. On the other hand if he spends his entire income on purchase of good Y, he can buy $\Big(\frac{\ ₹ \ 20}{\ ₹\ 4} \Big)$ 5 units of Y. This is shown by point L. By joining points L and M, we get a line known as “Budget Line”, which shows different combinations of good X and good Y which can be purchased with given money income (here ₹ 20).

Slope of Budget Line = Ratio of prices of two commodities $=\frac{\text{P}_\text{X}}{\text{P}_\text{Y}}$

Equation of Budget Line, PX. X + PY.Y = m

where, m = Money income

PX and PY are per unit price of good X and good Y respectively.

X and Y are quantity of good X and good Y respectively.

View full question & answer
Question 594 Marks
Explain the concept of 'Marginal Rate of Substitution' with the help of a numerical example. Also, explain its behaviour along an Indifference Curve.

OR

Explain the concept of Marginal Rate of Substitution (MRS) by giving an example. What happens to MRS when consumer moves downward along the Indifference Curve?

Answer
Marginal Rate of Substitution refers to the rate at which the consumer is willing to sacrifice one good to obtain one more unit of the other good. Symbolically,

$\text{MRS}_\text{xy}=\frac{\text{Quantity of the Good Sacrificed}}{\text{Quantity of the Good Obtained}}\text{ or }= \frac{\Delta\text{y}}{\Delta\text{x}}$

MRS tends to fall when a consumer moves downward along the Indifference Curve.

Example:

Good 'A'

Good 'B'

$\text{MRS}\bigg(\frac{\Delta\text{B}}{\Delta\text{A}}\bigg)$

10

80

20

40

40 : 10 = 4

30

20

20 : 10 = 2

40

10

10 : 10 = 1

View full question & answer
Question 604 Marks
Explain the concept of marginal rate of substitution (MRS) by giving an example. What happens to MRS when a consumer moves downwards along the indifference curve? Give reasons for your answer.
Answer
Marginal Rate of Substitution: MRS of X for Y refers to the number of units of good Y that the consumer is willing to forego for an additional unit of good X, so as to maintain the same level of satisfaction.

$\text{MRS}=\frac{\Delta\text{Y}}{\Delta\text{X}}$

The concept of MRS can be understood with the help of following table:

Combinations
Units of X (Shirts)
Units of Y (Trousers)
MRSXY
A
1
20
-
B
2
16
4Y : 1X
C
3
13
3Y : 1X
D
4
11
2Y : 1X
E
5
10
1Y : 1X
At combination A, consumer has 1 unit of shirt and 20 trousers which represents that MU of shirts is higher than that of trousers due to which consumer becomes willing to sacrifice 4 trousers in order to gain one shirt when he moves from A to B. As soon as consumer sacrifices trousers to gain shirt, his MU for trousers increases and hence he becomes ready to sacrifice lesser trousers (3) in order to gain one more shirt when he moves from combination B to combination C.

Hence with changes in relative MU for shirts and trousers, MRS keeps on falling with every increase in quality of shirts.

View full question & answer
Question 614 Marks
Explain the concept of marginal rate of substitution. Explain the reaction of the consumer when marginal rate of substitution is higher than the ratio of prices.
Answer
Marginal Rate of Substitution: MRS of X for Y refers to the number of units of good Y that the consumer is willing to forego for an additional unit of good X, so as to maintain the same level of satisfaction.

$\text{MRS}=\frac{\Delta\text{Y}}{\Delta\text{X}}$

As the given consumer moves downwards along the indifference curve, we observe that MRS (i.e. the slope of the Indifference curve) continuously declines. This implies that the indifference curve, is convex.

When, $\text{MRS}>\frac{\text{P}_\text{X}}{\text{P}_\text{Y}}$

This means to get one more unit of commodity X consumer is willing to sacrifice more units of commodity Y then the market requires. It shows that consumer is willing to pay higher price of commodity X than the market requires. Consumer will now buy more of commodity X and buy less of commodity Y. This will bring down MRS till it becomes equal to PX/PY and the equilibrium is thus restored.

View full question & answer
Question 624 Marks
Explain consumer's equilibrium in case of single commodity with the help of utility schedule.

OR

How does a consumer reach equilibrium position when he is buying only one commodity? Explain with the help of marginal utility schedule.

OR

How many units of a commodity should a consumer buy to get maximum utility? Explain with the help of a numerical example.

OR

Given the market price of good, how does a consumer decide as to how many units of that good to buy? Explain.

Answer
Consumer's equilibrium with respect to purchase of one good is attained when:

  1. The marginal utility of the good is equal to its price.
  2. MU should decrease with increase in consumption.

Example: Suppose a consumer is buying oranges and the price of each unit of orange is ₹ 4. Hypothetical marginal utility schedule of orange is given as:

Units of Orange Consumed Marginal Utility (in MUX) Price (PX) ()
1 10 4
2 8 4
3 6 4
4 4 4
5 2 4

$\text{P}_\text{X}=\text{MU}_\text{X}$

It is evident from the schedule that the consumer will purchase ₹ 4 units of oranges to reach an equilibrium position. In this situation, the condition of consumer's equilibrium MUX (in ₹) = P is satisfied. At this level of consumption, the marginal utility is equal to the price of orange, i.e., ₹ 4 = ₹ 4.

View full question & answer
Question 634 Marks
Explain any three factors that affect price elasticity of demand.
Answer
The factors affecting price elasticity of demand are:

  1. Availability of close substitutes for the commodity: A commodity will have elastic demand if there are close substitutes available, e.g., Pepsi, Coca-Cola, Frooti. A commodity having no substitutes, e.g., salt will have inelastic demand.

  2. Nature of good: Generally, the demand for necessaries is inelastic and that for luxuries elastic. This is so because certain goods which are essential for life will be demanded at any price, whereas goods as luxuries can be dispensed easily if they appear to be costly.

  3. Uses of the commodity: If a commodity has only a few uses, e.g., butter, its demand is likely to be inelastic. If on the other hand, a commodity has many uses, its demand is likely to be elastic, e.g., milk.

  4. Share in total expenditure on the commodity: The demand for such commodities where a small part of the income spent is generally inelastic such as commodities like needle, match box, etc. On the other hand, the demand for such commodities where a significant part of income is spent, is very elastic, such as demand for woollen suit, other luxuries etc.

  5. Tastes and preferences/ Habits: If the consumers are habitual of some commodities, the demand for such commodities will be usually inelastic, because they will use them even if their prices go up. A smoker generally does not smoke less when the price of cigarettes goes up.

View full question & answer
Question 644 Marks
Distinguish between inferior good and normal good. Explain the effect of change in income on the demand curve of each good. Use diagram.

OR

Distinguish between normal goods and inferior goods, with examples.

Answer
  1. Inferior good: Inferior goods are those goods whose demand decrease when the income of the consumer increases and vice-versa. In other words, in case of inferior good, there is an inverse relationship between demand and income of the consumer, e.g., the demand for bajra will fall with the rise in the income of the consumer. Hence, bajra becomes inferior good at a higher level of income In case of inferior good, with increase in income, demand curve shifts to the left from DD to D0D0, whereas it shifts to the right from DD to D1D1 with decrease in income.

  1. Normal good: Normal good is the good for which the demand rises with increase in the income of the consumer. In other words, in case of normal good, there is a direct relationship between income of a consumer and his demand for normal good, e.g., the demand for rice and wheat will increase with every increase in income. Thus, rice and wheat are normal goods.

In case of normal good, with increase in income demand curve shifts to the right from DD to D1D1, whereas it shifts to the left from DD to D0D0 with decrease in income.

-

View full question & answer
Question 654 Marks
Distinguish between decrease in demand and decrease in quantity demanded.
Answer
Differences between decrease in demand and decrease in quantity demanded are:
S. No.
Basis
Decrease in demand
Decrease in quantity demanded
1.
Meaning
It is defined as fall in demand at the same price of the commodity.
It is defined as fall in quantity demanded due to rise in price of the commodity.
2.
Direction
In this, there is a leftward shift in the demand curve.
In this, the consumer moves upward on the same demand curve.
3.
Graphs
4.
Reasons
It is due to:
1. Fall in consumer's income in case of normal goods.
2. Fall in the price of substitute goods.
3. Rise in the price of complementary goods.
4. Unfavourable changes in consumer's taste for this good.
It is due to rise in the price of the commodity only.
5.
Change in demand curve
It signifies shift of a demand curve.
It signifies movement along a demand curve.
View full question & answer
Question 664 Marks
Distinguish between change in demand and change in quantity demanded.
Answer
Differences between change in demand and change in quantity demanded are:
S. No.
Basis
Change in demand
Change in quantity demanded
1.
Factors
This is caused by change in determinants, other than own price of the commodity.
This is caused by change in own price of the commodity, other factors remaining constant.
2.
Effect
This happens when at the same price, more or less is being demanded.
This happens when at a lower price, more is being demanded or at a higher price, less is being demanded.
3.
Change in curve
Diagrammatically, this is shown as a forward or backward shift in demand curve.
Diagrammatically, this is shown as a downward or an upward movement on the same demand curve.
4.
Graph
View full question & answer
Question 674 Marks
Differentiate between Law of Demand and Price Elasticity of Demand.
Answer
S. No Basis

Law of Demand


(i) Meaning

Law of demand states, other things being equal, the inverse relation between price of a commodity and its quantity demanded.

Price Elasticity of Demand Price Elasticity of demand is the degree of responsiveness of quantity demanded due to change in price of the commodity.

(ii) Statement

It is qualitative statement, i.e., it reflects the direction of change in quantity demanded.


It is quantitative statement, i.e., it tells us the magnitude of the change in quantity demanded as a result of change in price.

(iii)

Shape of

Demand

Curve

View full question & answer
Question 684 Marks
Derive the law of demand from the two commodity equilibrium condition SEE “Marginal Utility = price ratio through utility approach”.
Answer
  1. The law states that a consumer is in equilibrium when the ratio of MU to price in case of each good consumed is the same. In of goods, X and Y, a consumer is in equilibrium when, $\frac{\text{MU}_\text{x}}{\text{P}_\text{x}}=\frac{\text{MU}_\text{y}}{\text{P}_\text{y}}$
  2. Given that the consumer is in equilibrium and price of X falls. It can be seen from the figures that Figure B is derived from Figure A.

  1. In figure A, initially, the consumer equilibrium is attained at point E, MU, MU, where $\frac{\text{MU}_\text{x}}{\text{P}_\text{x}}=\frac{\text{MU}_\text{y}}{\text{P}_\text{y}}$ (Assuming Px = 10) Corresponding to point E, we derive point E, in figure B.
  2. Due to fall in price (suppose from  10 to 8), $\frac{\text{MU}_\text{x}}{\text{P}_\text{x}}>\frac{\text{MU}_\text{y}}{\text{P}_\text{y}},$ at the given P , quantity Q. It means, marginal utility from the last rupee spent on commodity X is more than marginal utility from the last rupee spent on commodity Y. So, to attain the equilibrium the consumer must increase the quantity of X, which decreases the MU and decreases the quantity of Y, which will increase the MU, Increase in quantity of X and decrease in quantity of Y continue til $\frac{\text{MU}_\text{x}}{\text{P}_\text{x}}=\frac{\text{MU}_\text{y}}{\text{P}_\text{y}}$. the new consumer equilibrium will be attained at point F. Corresponding to point F, we derive the point F1, in figure B. So, by joining point E1, and F2, we derive the demand curve.
View full question & answer
Question 694 Marks
Define price elasticity of demand. Explain its various degrees. Use diagrams.
Answer
Price elasticity of demand is the degree of responsiveness of the quantity demanded of a good to a change in its price.
There are five degrees of price elasticity of demand which are given as:
  1. Perfectly Elastic Demand $(\text{e}_\text{D}=\infty)$: When the demand of a commodity rises or falls to any extent at the prevailing price, it is said to be perfectly elastic demand. Here coefficient of elasticity of demand = ∞ (infinity). PD denotes perfectly elastic demand curve, parallel to the OX axis.

  1. Perfectly Inelastic Demand (eD = 0): When the demand of a commodity does not change at all irrespective of any change in its price, it is said to be perfectly inelastic demand. Here coefficient of elasticity of demand = 0 (zero).

  1. Unit Elastic Demand (eD = 1): When percentage change in the demand of a commodity is equal to the percentage change in its price, it is said to be unit elastic demand. Here coefficient of elasticity of demand = 1.

  1. More Elastic Demand (eD > 1): When percentage change in demand of a commodity is more than the percentage change in its price, it is called greater than unitary elastic demand. Here coefficient of elasticity of demand > 1.

  1. Less than Unitary Elastic Demand (eD < 1): When percentage change in demand of a commodity is less than the percentage change in its price, it is called less than unitary elastic demand or less elastic demand. Here coefficient of elasticity of demand < 1.
​​​​​​​
View full question & answer
Question 704 Marks
A consumer spends ₹ 400 on a good priced at ₹ 4 per unit. When the price rises by 25 percent, the consumer continues to spend ₹ 400. Calculate the price elasticity of demand by percentage method.
Answer
Price (₹)
Quantity (units)
Total Expenditure
4
100
400
$\Delta \text{p}=25\%; 4 + 1 = 5$
80
400

% rise in price = 25

$\frac{\Delta \text{p}}{\text{p}}\times100=25$

$\Delta \text{p}=\frac{25\times4}{100}=1$

Neq price = 4 + 1 = 5

Price
Qty.
T.E.
4
100
400
5
80
400

$\text{E}_\text{d}=\frac{\Delta \text{q}}{\Delta \text{p}}\times \frac{\text{p}}{\text{q}}$

$=\frac{-20}{1}\times\frac{4}{100}=(-)0.8$

View full question & answer
Question 714 Marks
A consumer spends ₹ 80 on a commodity when price is ₹ 1 per unit. If the price increases by ₹ 1, what would be his expenditure. PED = -0.4?
Answer

Initial Price (P) = 1

Initial Expenditure = 80

Initial Quantity (Q) $=\frac{\text{Exp.}}{\text{Price}}=80$

New Price (P1) = 2

New Expenditure = ?

New Quantity (Q1) = ?

​​​​$\Delta \text{P} = 1$   $\Delta\text{Q} = ?$

$\text{PED}=\frac{\Delta\text{Q}}{\Delta\text{P}}\times\frac{\text{P}}{\text{Q}}$

$-0.4=\frac{\Delta\text{Q}}{1}\times\frac{1}{80}$

$-32=\Delta \text{Q}$

As New Price is increasing from 1 to 2, quantity demanded must decrease by $\Delta\text{Q}.$

New Quantity = Initial Quantity + $\Delta\text{Q}=80+(-32)=48$

At Price = 2, Quantity demanded = 48.

The Expenditure at this Price = P × Q = 2 × 48 = 96

View full question & answer
Question 724 Marks
A consumer consumes only two goods.

Explain the conditions of the consumer's equilibrium with the help of Utility Analysis.

OR

State and explain the condition of consumer's equilibrium in case of two commodities through utility approach.

Answer
According to the two commodity consumer equilibrium a consumer gets maximum satisfaction, when $\frac{\text{MU}_\text{x}}{\text{P}_\text{x}}=\frac{\text{MU}_\text{y}}{\text{P}_\text{y}}$Conditions of Consumer's Equilibrium In case of Two Commodities.

Necessary Conditions: Marginal utility of last rupee spent on each commodity is same. Suppose there are two commodities, X and Y respectively. So, for commodity X, the condition is, Marginal Utility in terms of Money =Price of X $\frac{\text{Marginal Utility of a Product in utils [MU}_\text{x}]}{\text{Marginal Utility of one Rupee[MU}_\text{m}]}=\text{Price of X}$

Or

$\frac{\text{MU}_\text{x}}{\text{P}_\text{x}}=\text{MU}_\text{m}\dots(1)$

Similarly, for commodity Y, the condition is,

$\frac{\text{MU}_\text{Y}}{\text{P}_\text{Y}}=\text{MU}_\text{M}\dots(2)$ 

Putting equation (2) in (1), we get

$\frac{\text{MU}_\text{Y}}{\text{P}_\text{X}}=\frac{\text{MU}_\text{Y}}{\text{P}_\text{Y}}$

If, $\frac{\text{MU}_\text{x}}{\text{P}_\text{x}}>\frac{\text{MU}_\text{y}}{\text{P}_\text{y}}$

It means, marginal utility from the last rupee spent on commodity X is more than marginal utility from the last rupee spent on commodity Y. So, to attain the equilibrium, consumer must increase the quantity of X, which decrease the $\frac{\text{MU}_\text{x}}{\text{P}_\text{x}}$ and decrease the quantity of Y which will increase the $\frac{\text{MU}_\text{Y}}{\text{P}_\text{Y}}$ Increase in quantity of X and decrease in quantity of Y will continue till $\frac{\text{MU}_\text{x}}{\text{P}_\text{y}}=\frac{\text{MU}_\text{Y}}{\text{P}_\text{Y}}$

If, $\frac{\text{MU}_\text{x}}{\text{P}_\text{x}}<\frac{\text{MU}_\text{Y}}{\text{P}_\text{Y}}$.

It means, marginal utility from the last rupee spent on commodity X is less than marginal utility from the last rupee spent on commodity Y. So, to attain the equilibrium the consumer must decrease the quantity of X, which will increase the $\frac{\text{MU}_\text{X}}{\text{P}_\text{X}}$ and increase the quantity of Y, which will decrease the $\frac{\text{MU}_\text{Y}}{\text{P}_\text{Y}}$Decrease in quantity of X and Py increase in quantity of Y continues till $\frac{\text{MU}_\text{x}}{\text{P}_\text{x}}=\frac{\text{MU}_\text{Y}}{\text{P}_\text{Y}}$.

Sufficient Condition: Expenditure on commodity X + Expenditure on commodity Y = Money Income. In other words, law of Diminishing Marginal utility should be applicable.

View full question & answer
Question 734 Marks
A consumer consumes only two goods X and Y whose prices are ₹ 4 and ₹ 5 per unit respectively. If the consumer chooses a combination of the two goods with marginal utility of X equal to 5 and that of Y equal to 4, is the consumer in equilibrium? Give reasons. What will a rational consumer do in this situation? Use utility analysis.
Answer
Given that the PX = ₹ 4, PY = ₹ 5 and MUX = 5, MUY = 4.
The given consumer will be in eqiuilibrium when, $\frac{\text{MU}_\text{X}}{\text{P}_\text{X}}=\frac{\text{MU}_\text{Y}}{\text{P}_\text{Y}}.$
Now subsituting the given values, we find that $\frac{\text{MU}_\text{X}}{\text{P}_\text{X}}>\frac{\text{MU}_\text{Y}}{\text{P}_\text{Y}}\text{ or }\frac{5}{4}>\frac{4}{5}$
Since per rupee MUX is higher than per rupee MUY, the consumer is not in equilibrium. The given consumer will buy more of X and less of Y. As a result, MUX will fall and MUY will rise. The reaction will continue till MUX / PX and Muy are equal and the given consumer will be in equilibrium again.
View full question & answer
Question 744 Marks
A consumer consumes only two goods X and Y whose prices are ₹ 4 and ₹ 5 per unit respectively. If the consumer chooses a combination of the two goods with marginal utility of X equal to 5 and that of Y equal to 4, is the consumer in equilibrium? Give reasons. What will a rational consumer do in this situation? Use utility analysis.
Answer
The utility analysis in the above examination problem is the two commodity consumer equilibrium condition or law of equi-marginal utility. The condition for two commodity consumer equilibrium is, Marginal utility of last rupee spent on commodity X $\Big(\frac{\text{MU}_\text{x}}{\text{P}_\text{x}}\Big)$

= Marginal utility of last rupee spent on commination Y $\Big(\frac{\text{MU}_\text{y}}{\text{P}_\text{y}}\Big)$

In the above examination problem, MUx = 5, Px = 4, then

$\frac{\text{MU}_\text{x}}{\text{P}_\text{x}}=\frac{5}{4}=1.25$

MUy = 4,Py = 5, then

 $\frac{\text{MU}_\text{y}}{\text{P}_\text{y}}=\frac{4}{5}=0.8$

The above example given inequality as, $\frac{\text{MU}_\text{x}}{\text{P}_\text{x}}>\frac{\text{MU}_\text{y}}{\text{P}_\text{y}}$

It means, marginal utility from the last rupee spent on commodity X is more than marginal utility from the last rupee spent on commodity Y. So, to attain the equilibrium consumer must increase the quantity of X, which decrease the MU, and decrease the quantity of Y which will increase the MU, Increase in quantity of X and decrease in quantity of Y continue till $\frac{\text{MU}_\text{x}}{\text{P}_\text{x}}=\frac{\text{MU}_\text{y}}{\text{P}_\text{y}}$.

View full question & answer
Question 754 Marks
A consumer consumes only two goods X and Y both priced at ₹ 3 per unit. If the consumer chooses a combination of these two goods with Marginal Rate of Substitution equal to 3, is the consumer in equilibrium? Give reasons. What will a rational consumer do in this situation? Explain.
Answer
Given that PX = 3, PY = 3 and Marginal Rate of Substitution = 3. A consumer is said to be in equilibrium when $\text{MRS} >\frac{\text{P}_\text{X}}{\text{P}_\text{Y}}.$
By substituting the values, we find that $ 3>\frac{3}{3}$ i.e., $\text{MRS} >\frac{\text{P}_\text{X}}{\text{P}_\text{Y}}$ in the given case, thus, the consumer is not in equilibrium because when $\text{MRS} >\frac{\text{P}_\text{X}}{\text{P}_\text{Y}}$ it implies that the consumer is willing to pay more for unit of X, as compared to what market demands. The consumer will buy more and more of X. As a result, MRS will fall due to the Law of Diminishing Marginal Utility. This will continue till $\text{MRS} >\frac{\text{P}_\text{X}}{\text{P}_\text{Y}}$ and the consumer is again in equilibrium.
View full question & answer
Question 764 Marks
A consumer consumes only two goods. Why is the consumer said to be in equilibrium when he buys only that combination of the two goods which lies at that point on the indifference curve where the budget line is tangent to the indifference curve? Explain. Use diagram.

OR

Using indifference curve analysis, explain the concept of consumer's equilibrium.

Answer
Consumer equilibrium is defined as the level of consumption where the consumer is able to achieve maximum level of satisfaction from his given money income and price of the commodities. Indifference curves represent different scale of preferences or levels of satisfaction which are available from different combinations of two commodities which a consumer wants to consume. On the other hand, a budget line represents all the combinations that a consumer is able to consume by spending his entire money income on both the commodities. The consumer will consume only that combination for which he has both preference and ability to consume, the consumer equilibrium must lie on both indifference curve and the budget line.
Graphical representation: The concept of consumer equilibrium can be explained with the help of given diagram.

In the given diagram IC1, IC2 and IC3 represent the indifference map for the consumer representing the consumer's scale of preferences. AB represents the budget line, which shows various combinations of the two commodities that a consumer can purchase from his given income and price of the commodities.
According to the given conditions, the consumer will not be able to purchase W combination or any combination which lies on IC3 as it lies outside the budget line. The consumer will be able to consume either C or D or E combinations, which lie on both indifference curve as well as the budget line. Since combination E lies on a higher indifference curve IC2 it will represent a higher level of satisfaction to the consumer as compared to C and D. Hence, the consumer equilibrium will be achieved at E where the budget line is tangential to the indifference curve according to which the consumer will consume OX units of commodity X and OY units of commodity Y.
Conditions:
  1. The budget line should be tangential to the indifference curve.
  2. IC should be strictly convex to origin, i.e., MRS should continuously decrease.
View full question & answer
Question 774 Marks
A consumer buys 18 units of a good at a price of ₹ 9 per unit. The price elasticity of demand for the good is (-)1. How many units the consumer will buy at a price of 10 ₹ per unit? Calculate.
Answer
Original Quantity (Q) = 18 units
Original Price (P) = ₹ 9
New Quantity (Q1) = ?
New Price (P1) = 10
Change in Quantity $(\Delta \text{Q})= ?$
Change in Price $(\Delta \text{P}) = 1$
Elasticity of Demand (ED) = (-)1

$\text{PED}=\frac{\Delta\text{Q}}{\Delta\text{P}}\times\frac{\text{P}}{\text{Q}}$

$-1=\frac{\Delta \text{Q}}{1}\times\frac{9}{18}$

$-2=\Delta \text{Q}$

As New Price is increasing from 9 to 10, quantity demanded must decrease by $\Delta\text{Q}.$

New Quantity = Initial Quantity + $\Delta\text{Q}=18+(-2)=16$

At Price = 10, Quantity demanded = 16.

View full question & answer
Question 784 Marks
A consumer buys 10 units of a commodity at a price of ₹ 10 per unit. He incurs an expenditure of ₹ 200 on buying 20 units. Calculate Price Elasticity of Demand by percentage method. Comment on the shape of demand curve based on this information.
Answer
Price (₹) (P)
Quantity demanded (units) (Q)
Total expenditure (₹) (P × Q)
10
10
100
10
20
200

Total Expenditure = Price(P1) × Quantity (Q1)

200 = Price (P1) × 20

200 ÷ 20 = Price (P1)

Price (P1) = ₹ 10 per unit

$\Delta\text{P}=10-10=0$

$\Delta\text{Q}=20-10=10$

Percentage Change in Quantity Demanded $=\frac{\Delta \text{Q}}{\text{Q}}\times100$

$=\frac{10}{10}\times100=100\%$

Percentage Change in Price $=\frac{\Delta \text{P}}{\text{P}}\times100$

$=\frac{0}{10}\times100=0\%$

$\text{E}_\text{d}= \frac{\text{Percentage Change in Quantity Demanded}}{\text{Percentage Change in Price }}$

$=\frac{100}{0}=\infty $

$\text{E}_\text{d}=\infty$

Elasticity of Demand is perfectly elastic. Therefore, demand curve is a straight line parallel to X-axis.

View full question & answer