Question
Explain the distinction between decrease in supply and contraction in supply. Use diagram.
|
S. No
|
Basis
|
Contraction in Supply
|
Decrease in Supply
|
|
1.
|
Causes
|
Contraction of supply is caused by fall in price of the given commodity, other things remaining the same.
|
Decrease in supply is caused by factors other than the price of the commodity, i.e., rise in price of other commodity, technology, rise in price of inputs etc.
|
|
2.
|
Supply curve
|
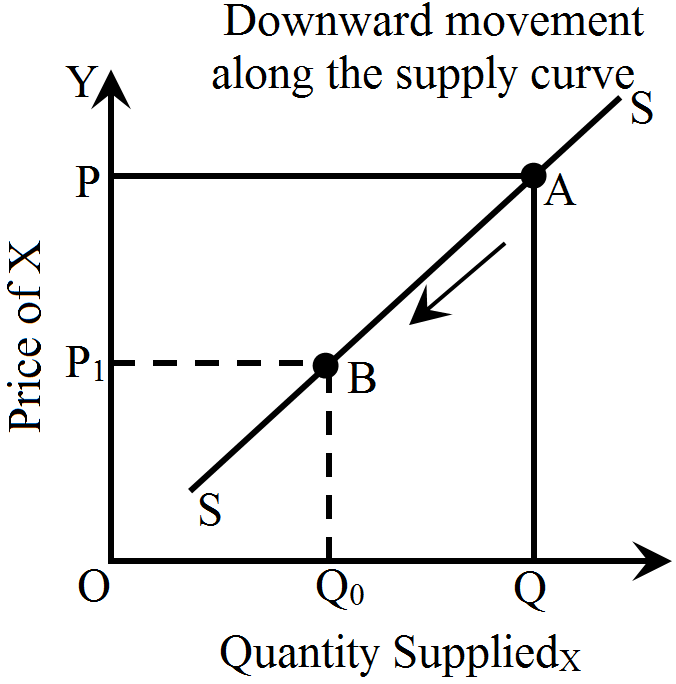
Contraction of supply is denoted by downward movement along a supply curve.
|
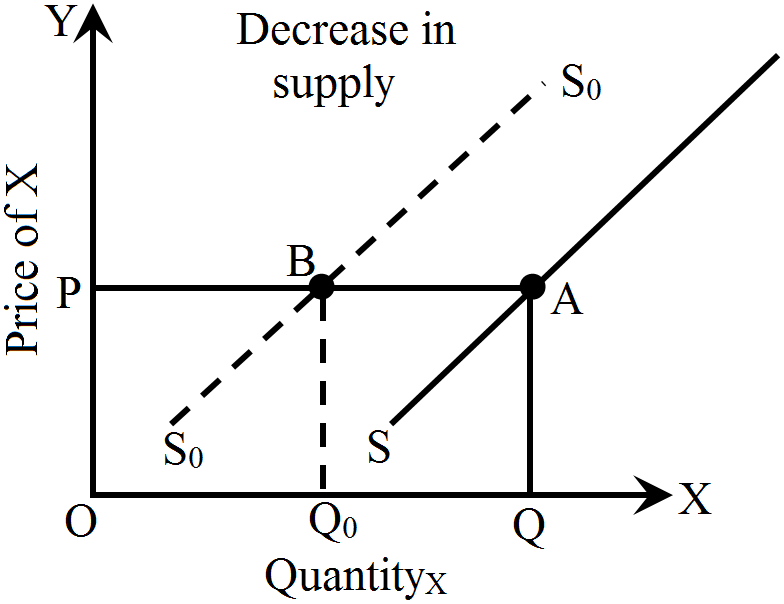
Decrease in supply of a commodity is denoted by leftward shift of the supply curve.
|
|
3.
|
Diagram
|
 |
 |
Generate a complete, print-ready paper with questions like this in minutes — across 16+ boards, with answer keys.
|
Output(Units)
|
1
|
2
|
3
|
4
|
5
|
6
|
7
|
|
Average Revenue (Rs.)
|
7
|
7
|
7
|
7
|
7
|
7
|
7
|
|
Total Cost (Rs.)
|
7
|
15
|
22
|
28
|
33
|
40
|
48
|
| Age Group | 20 -30 | 30 - 40 | 40 - 50 | 50 - 60 | 60 - 70 |
| Number of students | 25 | 60 | 40 | 20 | 20 |
| Number of Regular Players | 10 | 30 | 12 | 2 | 1 |
| Output (units) | Marginal Cost (MC) (₹) | Average Variable Cost (AVC) (₹) | Average Fixed Cost (AFC) (₹) | Average Cost (AC) (₹) |
| 1 | __ | __ | __ | 140 |
| 2 | __ | 45 | __ | __ |
| 3 | 45 | __ | 30 | __ |
| 4 | __ | 48 | 22.5 | __ |
| 5 | __ | 52 | 18 | __ |
| Output (Units) | Price(₹) | Total Cost(₹) |
| 1 | 10 | 13 |
| 2 | 10 | 22 |
| 3 | 10 | 30 |
| 4 | 10 | 38 |
| 5 | 10 | 47 |
| 6 | 10 | 57 |
| 7 | 10 | 71 |