Maharashtra BoardEnglish MediumSTD 10ScienceP-1 Heat3 Marks
Question
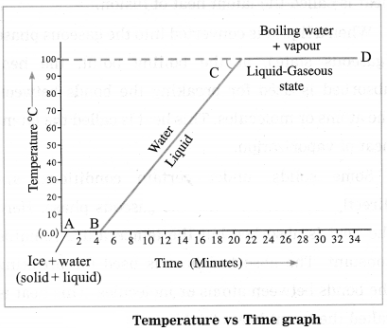
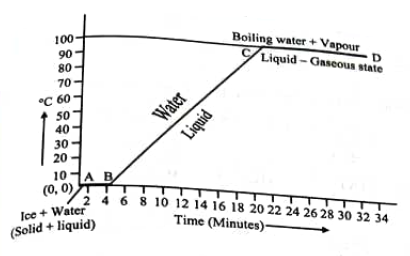
Explain the following temperature vs time graph:
✓
Answer
The graph shows what happens when a mixture of ice and water is heated continuously. The temperature of the mixture remains constant (0 °C) till all the ice melts as shown by the line AB. This temperature is the melting point of ice. On further heating, the temperature rises steadily from 0 °C to 100 °C as shown by the line BC, At 100 °C water starts converting into steam. This temperature is the boiling point of water. Further heating does not change the temperature and the conversion waters steam continues as shown by the line CD.
Need a full question paper?
Generate a complete, print-ready paper with questions like this in minutes — across 16+ boards, with answer keys.