Question
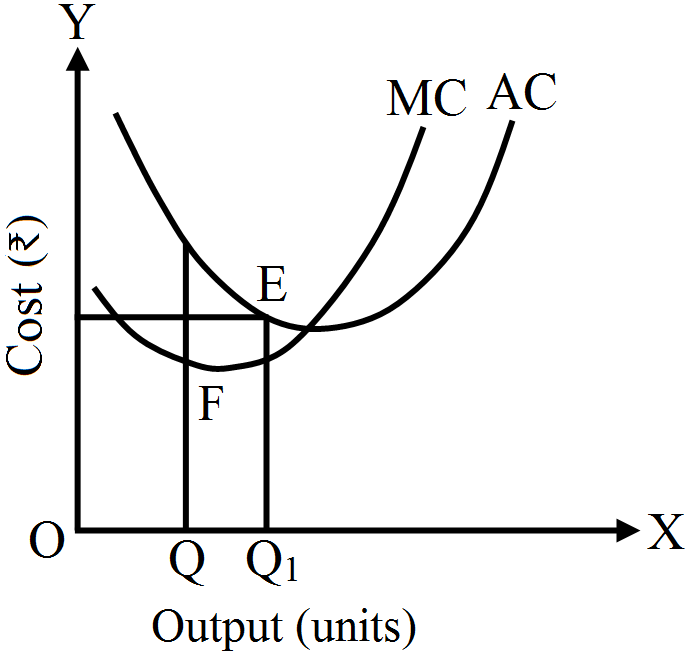
Explain the relationship between Marginal Cost and Average Cost using diagram.
Generate a complete, print-ready paper with questions like this in minutes — across 16+ boards, with answer keys.
| (₹ crore) | ||
| (i) | Gross National Disposable Income | 600 |
| (ii) | Net current transfers to abroad | (–) 20 |
| (iii) | Consumption of fixed capital | 60 |
| (iv) | Current transfers from government | 30 |
| (v) | Indirect tax | 100 |
| (vi) | Income accruing to government | 80 |
| (vii) | Subsidies | 10 |
| (viii) | Net factor income to abroad | (–) 10 |
| (ix) | National debt interest | 40 |
| (x) | Personal tax | 150 |
| Output units | Total cost Rs. | Average variable cost Rs. | Marginal cost Rs. | Average fixed costRs. |
| 0 | 30 | | | |
| 1 | --- | --- | 20 | --- |
| 2 | 68 | --- | --- | --- |
| 3 | 84 | 18 | --- | --- |
| 4 | --- | --- | 18 | --- |
| 5 | 125 | 19 | --- | 6 |