Question
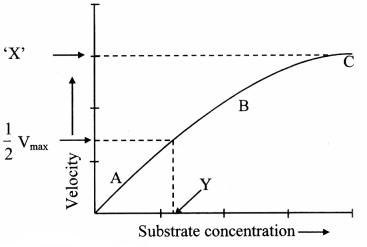
Following graph represents the effect of substrate concentration on enzyme activity. Identify $‘X \ ’$ and $‘Y \ ’$ Write proper explanation of the process.
Image

Answer

The factors affecting the enzyme activity are as follows:
$1.$ Concentration of substrate:
$a.$ Increase in the substrate concentration gradually increases the velocity of enzyme activity within the limited range of substrate levels.
$b.$ A rectangular hyperbola is obtained when velocity is plotted against the substrate concentration.
$c. $Three distinct phases $(A, B$ and$ C)$ of the reaction are observed in the graph.
Where $V =$ Measured velocity, $V_{max} =$ Maximum velocity, $S =$ Substrate concentration,
$K_m =$ Michaelis-Menten constant.
$d. \ K_m$ or the Michaelis$-$Menten constant is defined as the substrate concentration $($expressed in moles/lit$)$ to produce half of maximum velocity in an enzyme catalyzed reaction.
$e.$ It indicates that half of the enzyme molecules $($i.e. $50\%)$ are bound with the substrate molecules when the substrate concentration equals the $\ Km$ value.
$f. \ K_m$ value is a constant and a characteristic feature of a given enzyme.
$g.$ It is a representative for measuring the strength of $ES$ complex.
$h.$ A low $K_m$ value indicates a strong affinity between enzyme and substrate, whereas a high $\ Km$ value reflects a weak affinity between them.
$i.$ For majority of enzymes, the $K_m$ values are in the range of $10_{-5}$ to $10_{-2}$ moles.

Need a full question paper?

Generate a complete, print-ready paper with questions like this in minutes — across 16+ boards, with answer keys.

Start Generating Free