Question
How will compressional forces affect brittle rocks?
Generate a complete, print-ready paper with questions like this in minutes — across 16+ boards, with answer keys.
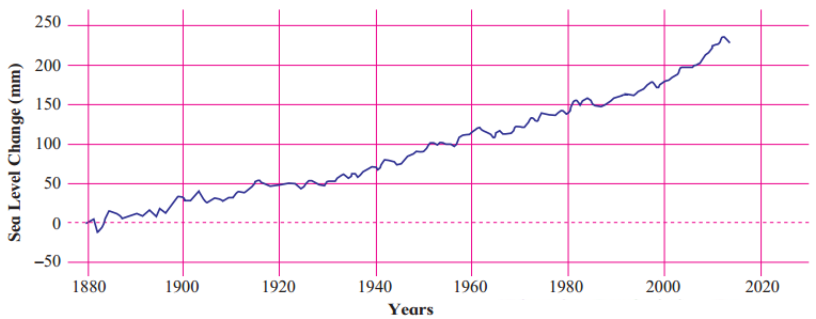
(1)What does the graph show?
(2)In which year is the change around 225 mm?
(3)What conclusions can you draw by seeing the graph?
(4)What correlation can be seen in this graph and the graph of rising temperature?