Question
List the techniques of Financial Statement Analysis.
Generate a complete, print-ready paper with questions like this in minutes — across 16+ boards, with answer keys.
|
|
₹
|
|
₹
|
|
Trade Receivables (Sundry Debtors).
|
1,80,000
|
Bills Payable.
|
20,000
|
|
Prepaid Expences.
|
40,000
|
Sundry Creditor.
|
1,00,000
|
|
Case and Case Equivalents.
|
50,000
|
Debentures.
|
4,00,000
|
|
Marketeble Securities.
|
50,000
|
Inventories.
|
80,000
|
|
Land and Building.
|
5,00,000
|
Expenses Payable.
|
80,000
|
|
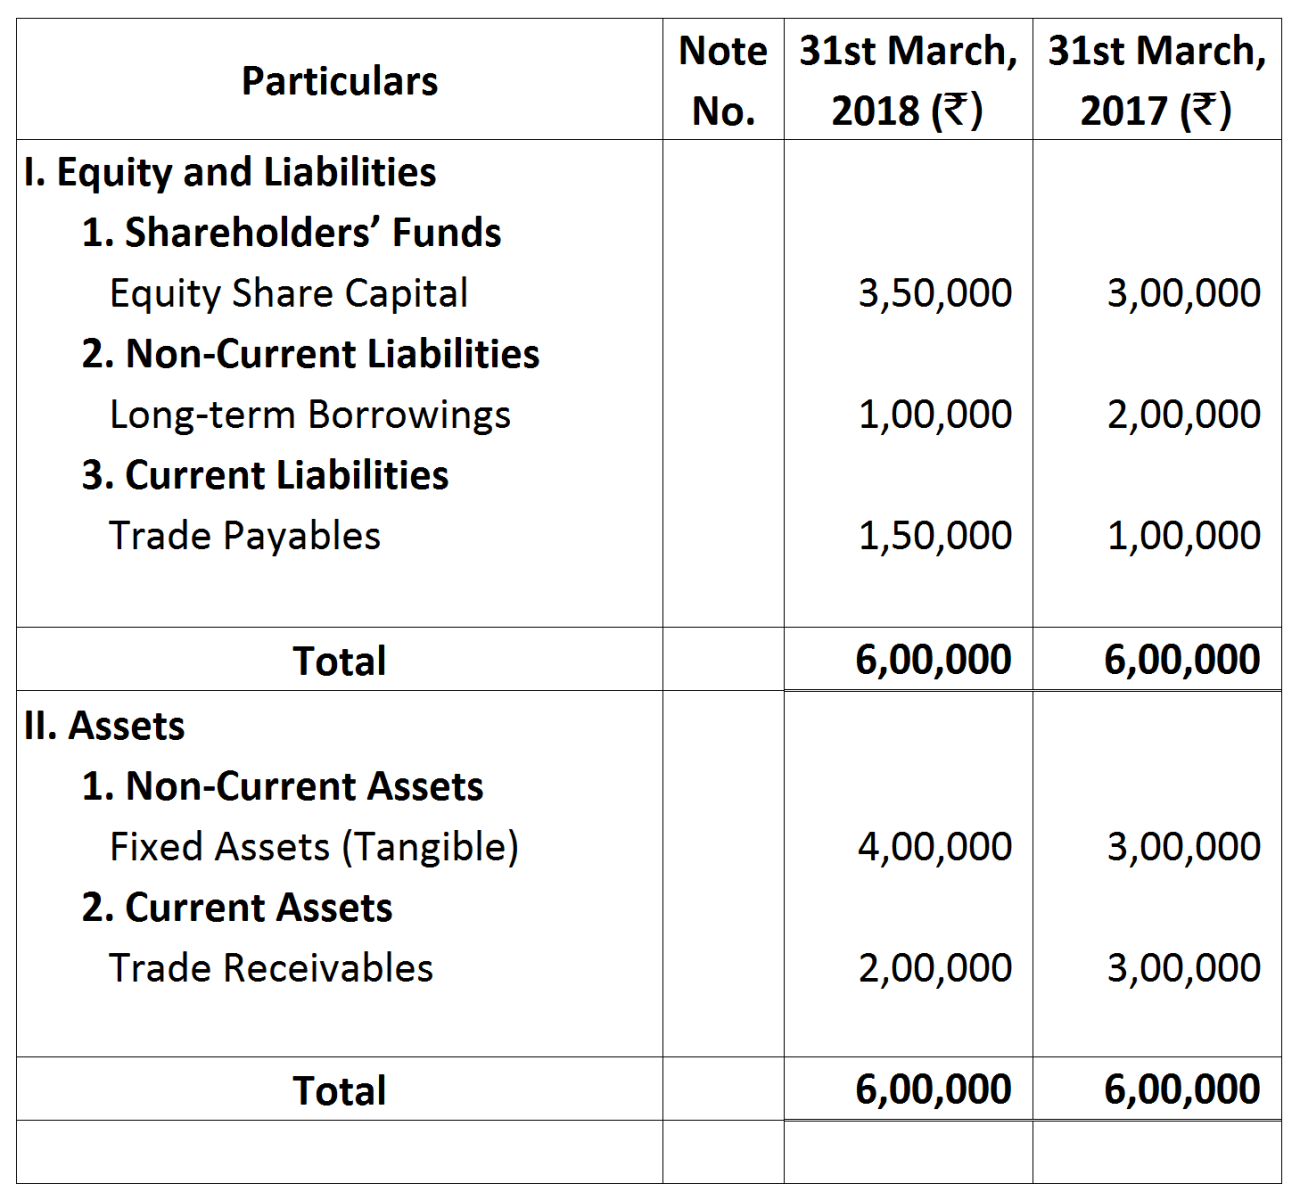
Particulars
|
31st March, 2018 ₹
|
31st March, 2017 ₹
|
|
Equity Share Capital
10% Preference Share Capital
Surplus, i.e., Balance in Statement of Profit and Loss
Unpaid Dividend
|
8,00,000
6,00,000
7,20,000
20,000
|
8,00,000
6,00,000
4,00,000
……
|