Questions

3 Marks Question

🎯

Test yourself on this topic

17 questions · timed · auto-graded

Question 13 Marks
From the following information provided prepare a comparative income statement for the period 2008 & 2009.
 
2008
2009
Sales (Rs.)
6,00,000
8,00,000
Gross Profit
40% on sales
50% on sales
Administrative expenses
20% of Gross profit
15% of Gross profit
Income tax
50%
50%
View full question & answer
Question 23 Marks
Why is Analysis of Financial Statements important to creditors?
Answer
Any of the following appropriate point.
  1. To study the ability of the business to meet its short term obligations.
  2. To study short term solvency of the business.
View full question & answer
Question 33 Marks
From the following information provided prepare a comparative income statement for the period 2008 & 2009.
  2008 2009
Sales (₹) 6,00,000 9,00,000
Gross Profit 40% on sales 50% on sales
Administrative expenses 20% of Gross profit 15% of Gross profit
Income tax 50% 50%
View full question & answer
Question 43 Marks
What are the importance of Financial Statement Analysis?
Answer
Importance of Financial Statement Analysis:
  1. Assessing the Profitability.
  2. Judging the efficiency.
  3. Judging the liquidity.
View full question & answer
Question 53 Marks
How is analysis of financial statements important to Government Authorities?
Answer
Government can judge on the basis of analysis of financial statements, which industry is progressing on the desired lines and which industry needs the financial help. Government can take a decision to reduce the GST in those industries where the profit margins are low in comparison to the cost of production. On the contrary, if the profit margins are too high in comparison to the cost of production, Government can increase the GST or can enforce the price regulations.
View full question & answer
Question 63 Marks
List the techniques of Financial Statement Analysis.
Answer
The following are the commonly used techniques of Financial Statement analysis:
  1. Comparative Financial Statements.
  2. Common Size Financial Statements.
  3. Trend Analysis.
  4. Ratio Analysis.
  5. Cash Flow Statement.
  6. Fund Flow Statement.
  7. The above listed techniques can be classified on the following basis:
A On the basis of Comparison.
Inter-firm Comparison.
  • Comparative Statement (Balance Sheet, Profit and Loss Account)
  • Common size Statement (of the same period)
  • Ratio of two or more Competitive Firms (of the same period)
  • Cash Flow Statement of two or more Competitive firms.
  • Polygon, Bar Diagram.
Intra-firm Comparison.
  • Comparative Statement (Balance Sheet, Profit and Loss Account)
  • Common size Statement (of the same period)
  • Ratio of two or more Competitive Firms (of the same period)
  • Cash Flow Statement of two or more Competitive firms
  • Polygon, Bar Diagram
Horizontal Comparison.

Vertical Comparison.
  1. On the basis of Time
Inter-period Comparison.
  • Comparative statement (two or more periods)
  • Cash Flow statement (two or more period) etc.
Cross Sectional (Intra-period) Comparison.
  • Common size statement
  • Ratio Analysis
  1. Horizontal Analysis.
  • Time series
  • Bar Diagram
  • Polygon
  • Comparative statement
  • Ratio Analysis
  1. Vertical Analysis.
  • Common size statement
  • Pie Diagram
View full question & answer
Question 73 Marks
Explain how common size statements are prepared giving an example.
Answer
The two Common Size Statements that are most commonly prepared are as follows.
  1. Common Size Balance Sheet.
  2. Common Size Income Statements.
Common Size Statement is prepared in a columnar form for analysis. In a Common Size Statement each item of the financial statements is compared to a common item. The analyses based on these statements are commonly known as Vertical Analysis.
The following are the columns prepared in a Common Size Statement.
  • Particulars Column: This column shows the various financial items under their respective heads.
  • Amount Columns: These columns depict the amount of each item, sub-totals and the gross total of a particular year.
  • Percentage or Ratio Columns: These columns show the proportion of each item to the common item either in terms of percentage or ratio.
The Common Size Statements can be presented in the following two ways.
Method 1:
Percentage Column is shown beside the Amount Column of the year to which percentage column belongs.

Method 2
Amount Columns are shown first and their percentage columns are shown after the Amount Columns.

The preparation of the Common Size Statements can be better understood by the help of the following example.


Working Note:
Percentage (Previous Year) $=\frac{\text{Previous Year Absolute Figure}}{\text{Balance Sheet Total of Previous Year}}\times100$
Percentage (Current Year) $=\frac{\text{Current Year Absolute Figure}}{\text{Balance Sheet Total of Previous Year}}\times100$
For example,
Percentage of Equity Share Capital (Previous Year) $=\frac{\text{4,00,000}}{\text{10,00,000}}\times100=40\%$
Percentage of Equity Share Capital (Current Year) $=\frac{\text{6,00,000}}{\text{13,20,000}}\times100=45.45\%$
Preparation
Step 1: Title of the Common Size Statement, i.e. ‘Common Size Balance Sheet’ is written on the top of the statement.
Step 2: In the ‘Particulars’ column, the various items of the Balance Sheet are shown under the headings of ‘Assets’ and ‘Equity and Liabilities’.
Step 3: In the ‘Amount’ column, amount of the items are shown in the ‘Year’ column to which they belong
Step 4: The Assets and Liabilities are totaled and are shown separately for each year.
Step 5: In the ‘Percentage’ column, the percentage of each item in comparison to the Total of Balance Sheet are shown.
View full question & answer
Question 83 Marks
What is Common Size Statement of Profit & Loss? What are its objectives?
Answer
In the Common size Statement of Profit and Loss, Revenue from Operations (Net Sales) is taken as 100 and expenses are expressed as percentage of Revenue from Operations (Net Sales). Common-size Statement of Profit and Loss may be prepared for different periods of the firm or for same period of two firms. It shows the relative efficiency i.n operating the business.Objectives of Common size Statement of Profit and Loss (Income Statement):
  1. To analyse change in individual items of Income Statement.
  2. To study the trend in different items of Incomes and Expenses.
  3. To assess the efficiency.
View full question & answer
Question 93 Marks
What is meant by Trend Percentage Analysis?
Answer
Trend percentages are very useful in making comparative study of the financial statements for a number of years. These indicate the direction of movement over a long time and help an analyst of financial statements to form an opinion as to whether favourable or unfavourable tendencies have developed. This helps in future forecasts of various items.
View full question & answer
Question 103 Marks
What is common size balance sheet? what are its objectives?
Answer
A common size balance sheet is a statement in which total of assets or equity & liabilities is assumed to be equal to 100 and all the figures are expressed as percentage of the total.Objectives of Common-size Balance Sheet:
  1. To analyse the changes in individual items of Balance Sheet.
  2. To see the trend of different items of assets, equity and liabilities.
  3. To assess the financial soundness and understand financial strategy.
View full question & answer
Question 113 Marks
Explain the usefulness of trend percentages in interpretation of financial performance of a company.
Answer
The Trend Analysis presents each financial item in percentage terms for each year. These Trend Analyses not only help the accounting users to assess the financial performance of the business but also assist them to form an opinion about various tendencies and predict the future trend of the business.Usefulness and Importance of Trend Analysis:
  1. Assists in forecasting: The trends provided by Trend Analysis help the accounting users to forecast the future trend of the business.
  2. Percentage Terms: The trends are expressed in percentage terms. Analysing the percentage figures is easy and also less time consuming.
  3. User Friendly: As the trends are expressed in percentage figures, so it is the most popular financial analysis to analyse the financial performance and operational efficiency of the company. In other words, one need not to have an in-depth and sophisticated knowledge of accounting in order to analyse these percentage trends.
  4. Presents a Broader Picture: The trend analysis presents a broader picture about the financial performance, viability and operational efficiency of a business. Generally, companies prefer to present their financial data for a period of 5 or 10 years in forms of percentage trends, whereas the other techniques of Financial Analysis lack this popularity.
View full question & answer
Question 133 Marks
Jai Ltd. is into the business of shoe manufacturing. On the occasion of its silver jubilee, it decided to distribute 1,000 shoes free of cost to the students belonging to economically weaker section of the society. Following is the Comparative Statement of Profit & Loss of the Company:
You are required to:
  1. Fill in the missing figures in the Comparative Statment of Profit & Loss.
  2. Identif y the values involved.
Answer
  1. Percentage(%) Change in:
  1. Values involved:
  1. Fulfilment of Social Responsibility.
  2. Concern for economically weaker section of the society.
View full question & answer
Question 143 Marks
What is vertical analysis of financial statements?
Answer
Vertical Analysis: In such type of analysis, financial statements for a single year or on a particular date are reviewed and analysed with the help of proper devices like ratios It involes a study quantitative amongs various items of Balance Sheet or Statement of Profit & Loss of a single period. The items in the financial statement are expressed as a percentage to total and the total is taken as equivalent to 100. Statements containing such analysis are termed as 'Common Size Statements'.
View full question & answer
Question 153 Marks
What is Comparative Balance Sheet? How is it prepared?
Answer
Comparative Balance Sheet analysis is the study of the trend of same items, group of items and computed items in two or more Balance Sheets of the same business enterprise on different dates. The fonn of comparative balance sheet consists of five columns.
In the first column the items of Balance Sheet are entered. ln the second column the data for previous year is shown and in the third column the data for current year is shown. In the fourth column the increases or decreases in absolute data is shown in terms of rupee amounts. Fifth column shows the percentage of increase or decrease in absolute data.
View full question & answer
Question 163 Marks
One of the objectives of 'Financial Statement Analysis' is to identify the reasons for change in the financial position of the enterprise. State two more objectives of this anlaysis.
Answer
Objectives of 'Financial Statements Analysis':
  • Assessing the earning capacity or profitability of the firm as a whole as well as its different departments so as to judge the financial health of the firm.
  • Assessing the managerial efficiency by using financial ratios.
  • Assessing the short-term and the long-term solvency of the enterprise.
  • Assessing their own perf onnance in comparison to other firms in the same business.
View full question & answer
Question 173 Marks
Fill in the missing figures in the following Common Size Statement of Profit & Loss:
Answer

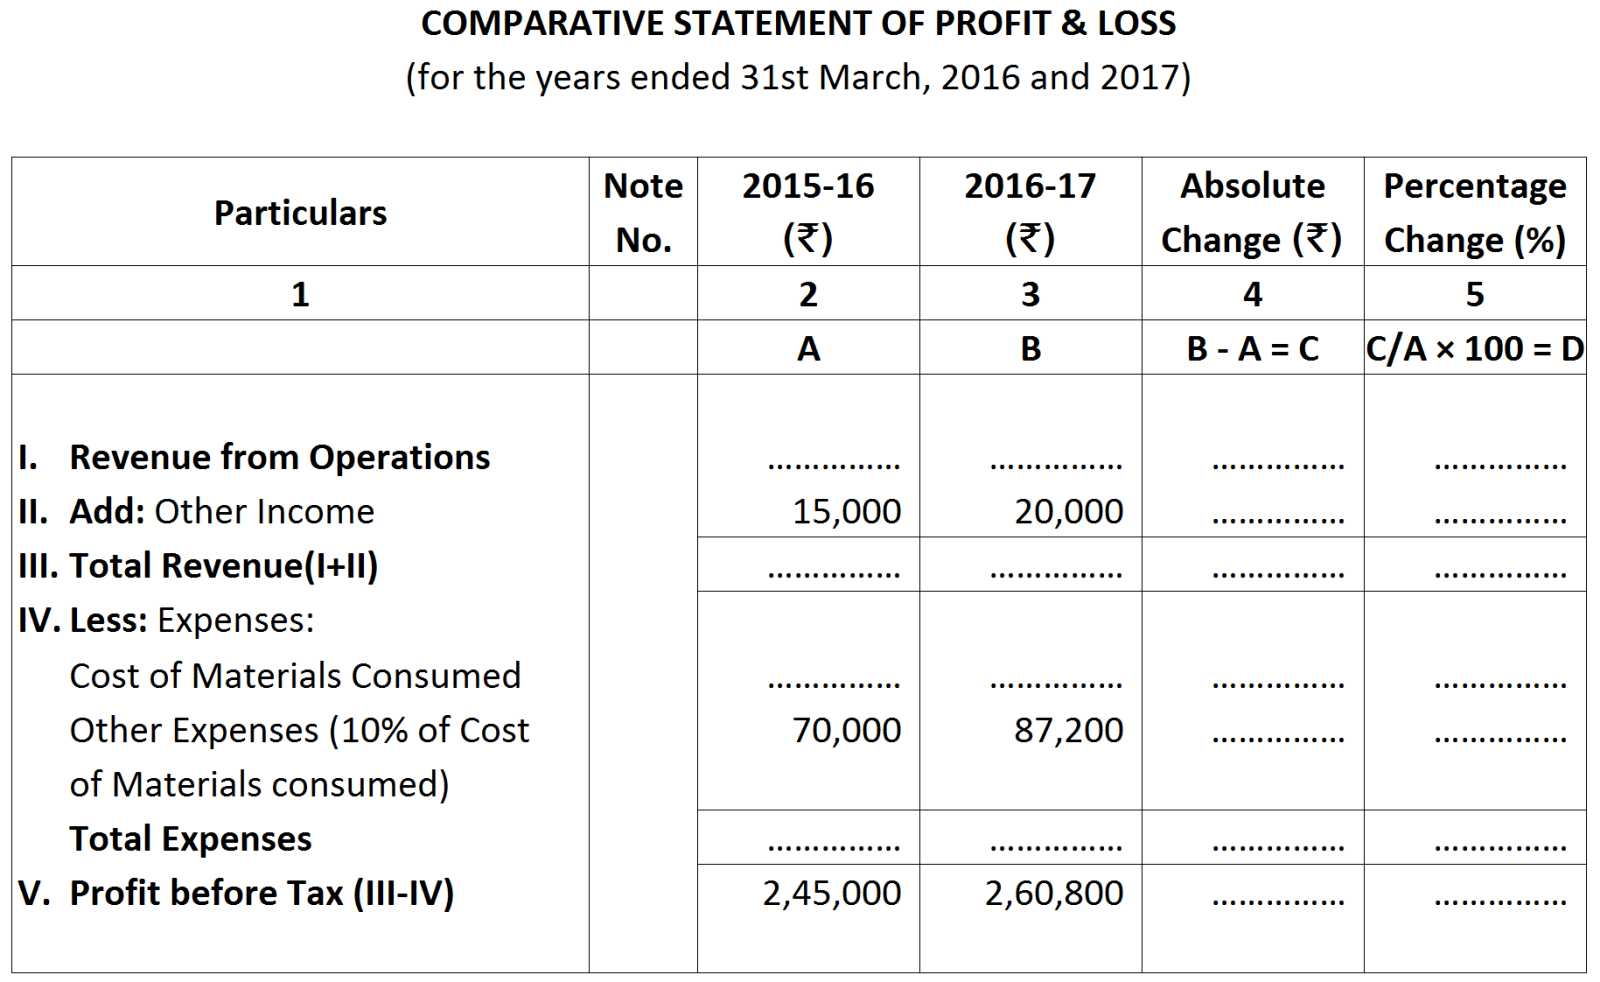
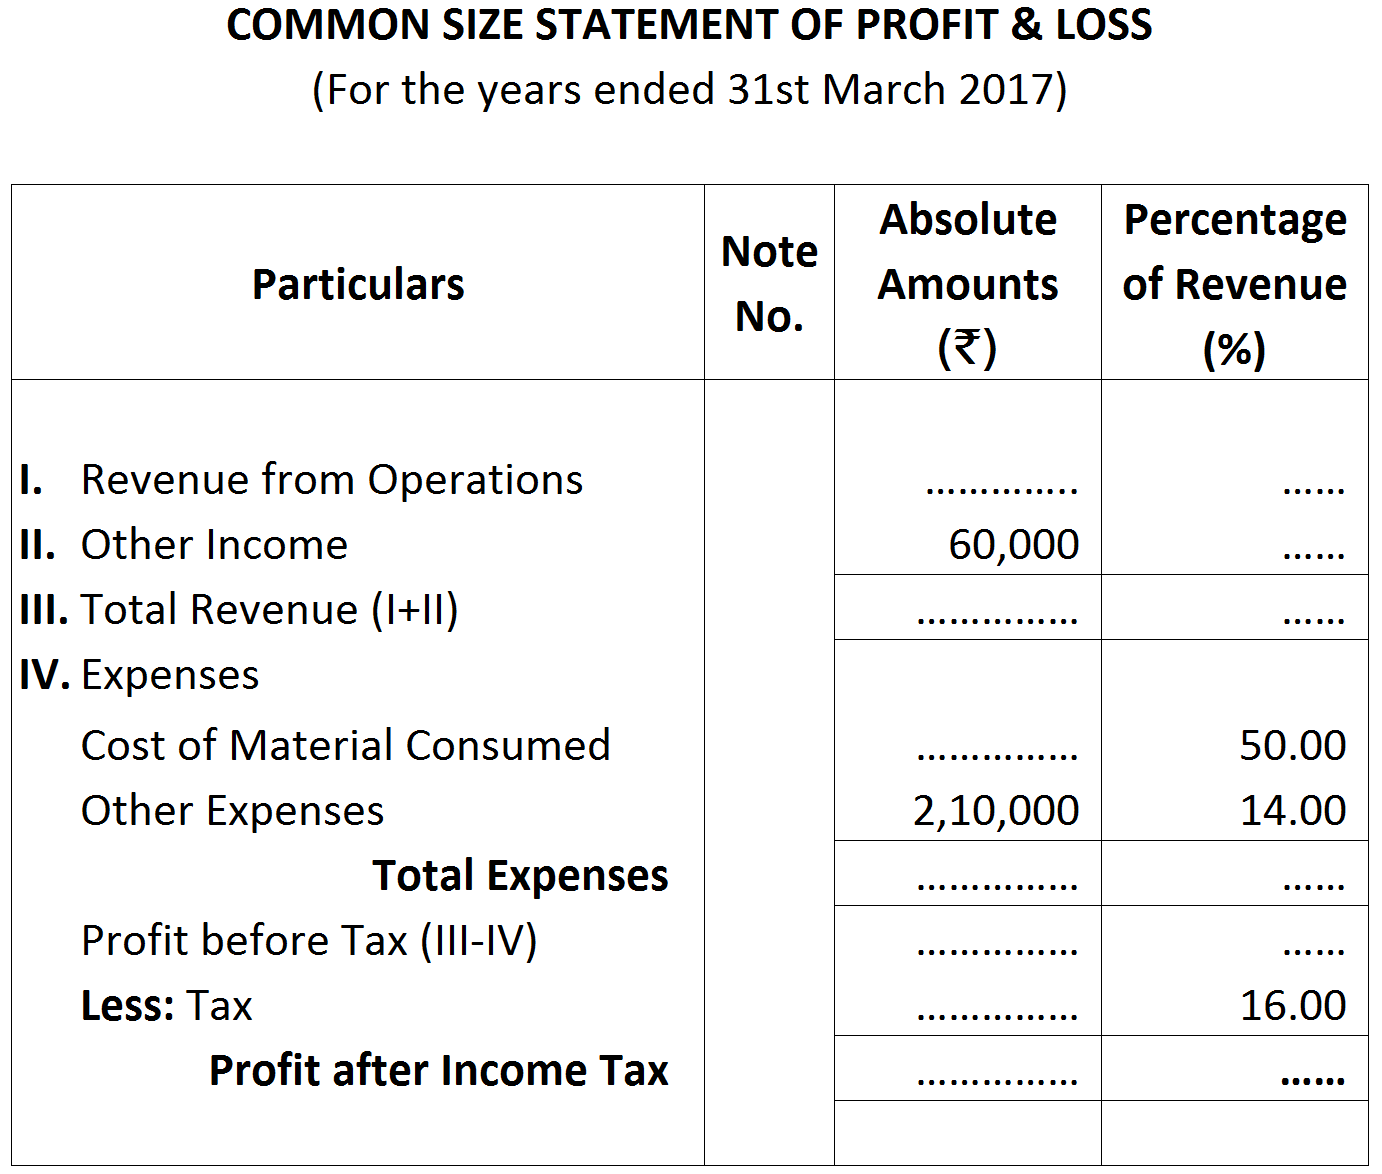
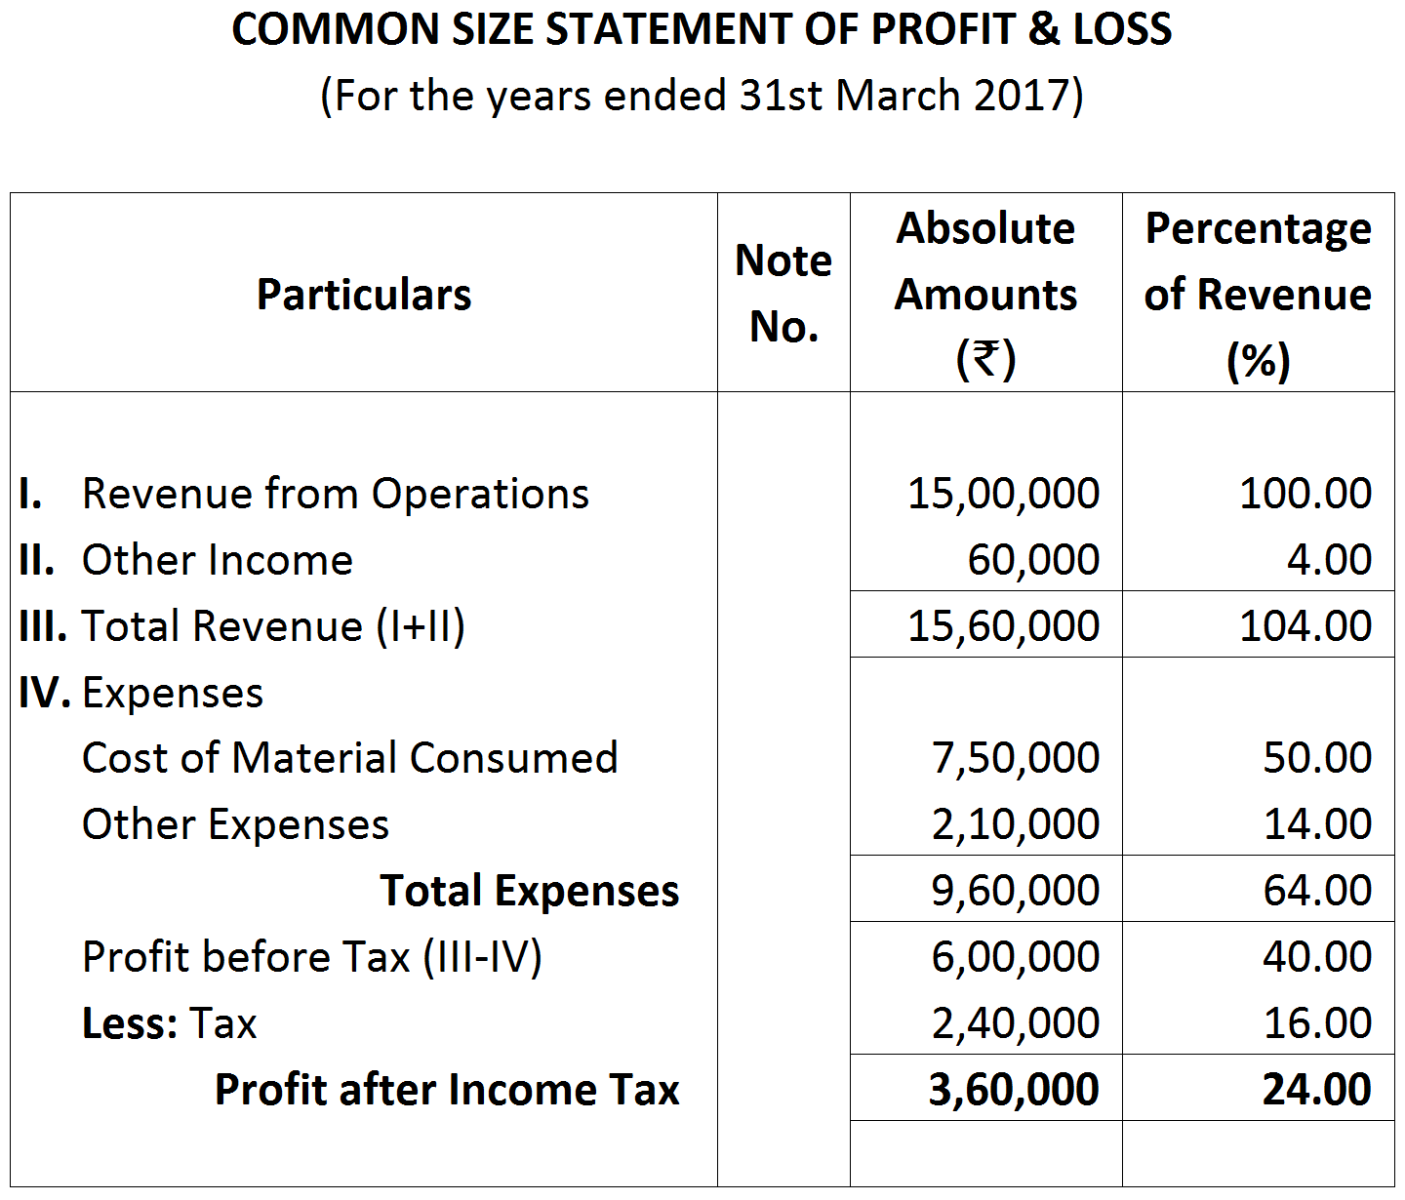
Hint: First of all, figure of Revenue from Operations will be calculated on the basis of 'Other Expenses'.
View full question & answer
3 Marks Question - Accountancy STD 12 Commerce Questions - Vidyadip