Question
Look at the graph and answer the questions.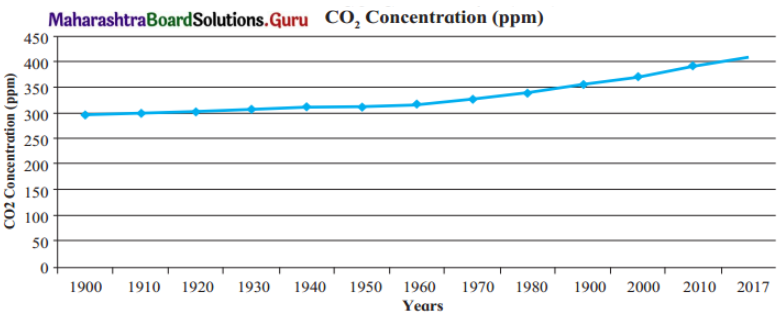
(1)What does this graph show?
(2)What does ppm mean?
(3)Since which year has the increase been phenomenal?
(4)Can you think of the reasons behind the increase in carbon dioxide?
(1)What does this graph show?
(2)What does ppm mean?
(3)Since which year has the increase been phenomenal?
(4)Can you think of the reasons behind the increase in carbon dioxide?