Question
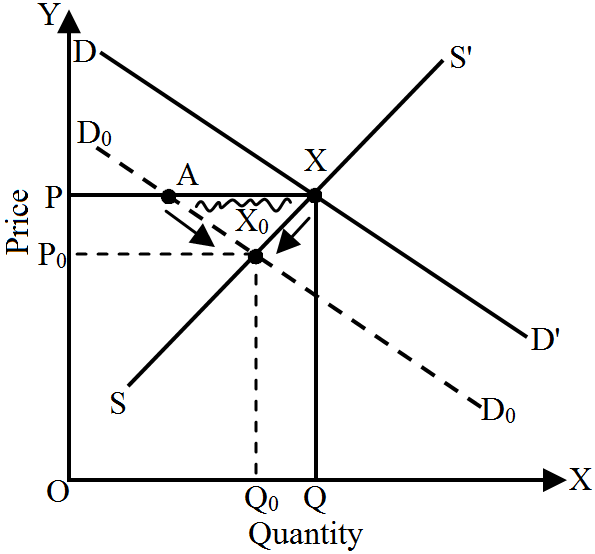
Market for a good is in equilibrium. There is 'decrease in demand for this good. Explain the chain of effects of this change. Use diagram.
OR
Market for a good is in equilibrium. The demand for the good 'decreases'. Explain the chain of effects of this change.
OR
Market of a good is in equilibrium. If the demand for the good decreases'. Explain the chain of effects of this change.

Answer

$DD'$ in the diagram shows the original demand curve and $SS'$ shows the original supply curve of the given commodity. Point $X$ denotes the point of equilibrium because both the above curves ($DD'$ and $SS'$) intersect at this point .$\therefore\text{Demand}=\text{Supply}$
$OP$ denotes the original equilibrium price and $OQ$ denotes the original equilibrium quantity. Now, When the demand for the product “decreases", the demand curve shifts to the left from $DD'$ to $D_0D_0$. This creates "excess supply" ‘AX’ at the given price $OP$.
The excess supply leads to a competition between the sellers, which results in a fall in the price from $OP$ to $OP_0$. This fall in price leads to a rise in demand along $D_0D_0$​​​​​​​ and fall in supply along $SS'$ curve (as indicated by the arrows). This trend will continue till the market reaches at the new equilibrium point $X_0$​ and the equilibrium price falls from $OP$ to $OP_0$ and equilibrium quantity also falls from $OQ$ to $OQ_0$​​​​​​​.

Need a full question paper?

Generate a complete, print-ready paper with questions like this in minutes — across 16+ boards, with answer keys.

Start Generating Free

Similar questions

Distinguish between movement along the supply curve and shift in the supply curve with the help of a suitable diagram.
Suppose that a firm's TFC is * 100 and MC schedule of the firm is the following:
Output (Units)
1
2
3
4
5
6
7
MC (₹)
10
20
30
40
50
60
70
  1. Is the MC curve U-shaped?
  2. Derive AVC schedule. Will the AVC curve be U-shaped? Discuss why or why not?
Compare between perfect competition and monopolistic competition.
The following is a production possibility table for war goods and civilian goods:
Combinations A B C D E
Automobiles (₹ 000s) 0 1 2 3 4
Rifles (lacs) 10 9 7 4 0
  1. Show these production possibilities through a PPC. What do the points on the curve indicate?
  2. Label point G inside the curve. What does this point indicate?
  3. Label point H outside the curve. What does this point indicate?
  4. What must an economy do to attain the level of production indicated by point H?
Market for a good is in equilibrium. Explain the chain of reactions in the market if the price is (i) higher than equilibrium price and (ii) lower than equilibrium price.
Complete the following table:
Output units
Total cost Rs.
Average variable cost Rs.
Marginal cost Rs.
Average fixed costRs.
0
30


1
---
---
20
---
2
68
---
---
---
3
84
18
---
---
4
---
---
18
---
5
125
19
---
6
Explain the concepts of (a) Marginal rate of substitution, (b) Budget line equation with the help of an example.
Giving reasons, state whether the following statements are true or false:
  1. Average cost falls only when marginal cost falls.
  2. The difference between average total cost and average variable cost is constant.
  3. When total revenue is maximum, marginal revenue is also maximum.
Calculate Q1 and Q3 from the following table.
Wages (in Rs.)Number of Workers
0-54
5-106
10-153
15-208
20-2512
25-307
A consumer spends ₹ 400 on a good priced at ₹ 4 per unit. When the price rises by 25 percent, the consumer continues to spend ₹ 400. Calculate the price elasticity of demand by percentage method.