Question 16 Marks
Explain how price is determined in a perfectly competitive market with fixed number of firms.
Answer
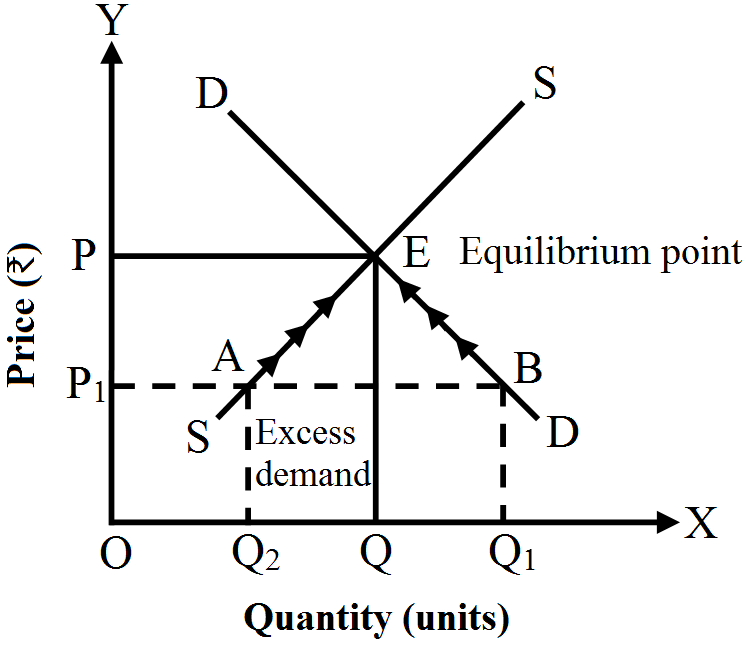
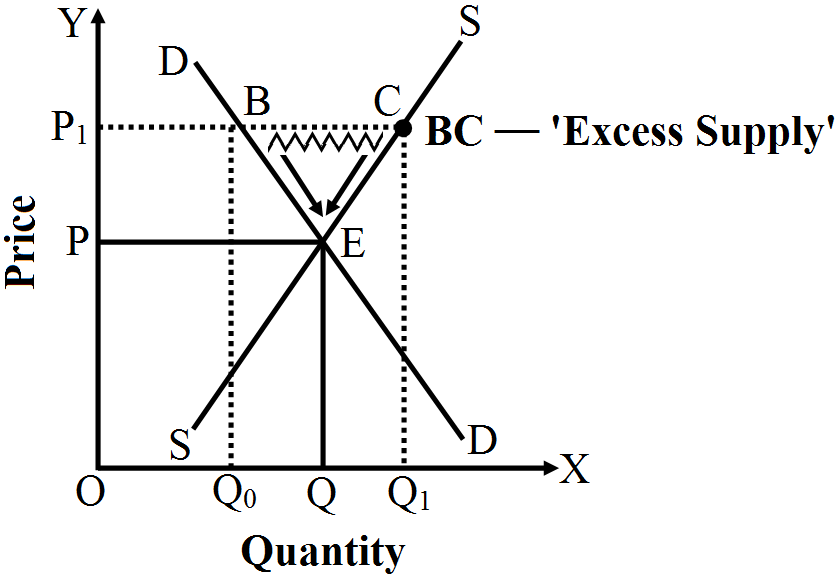
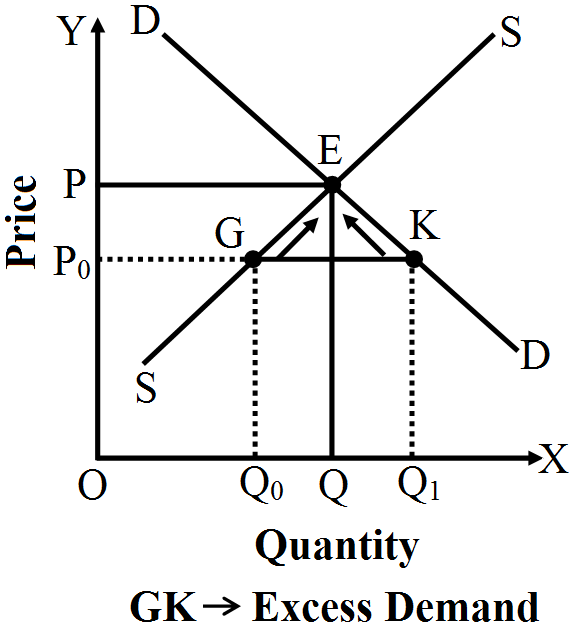
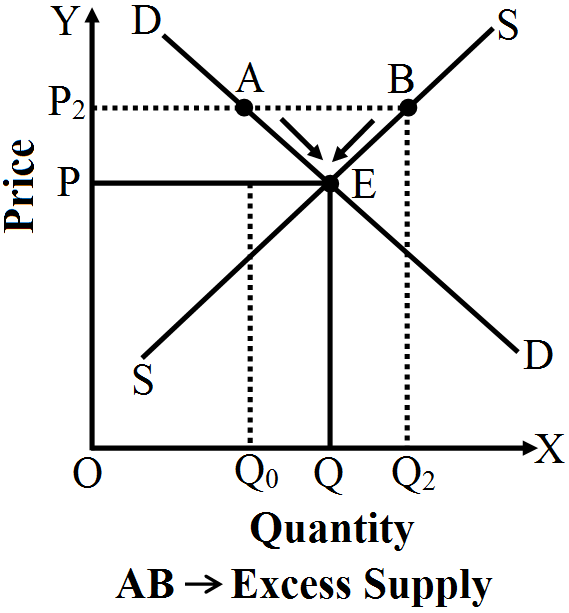
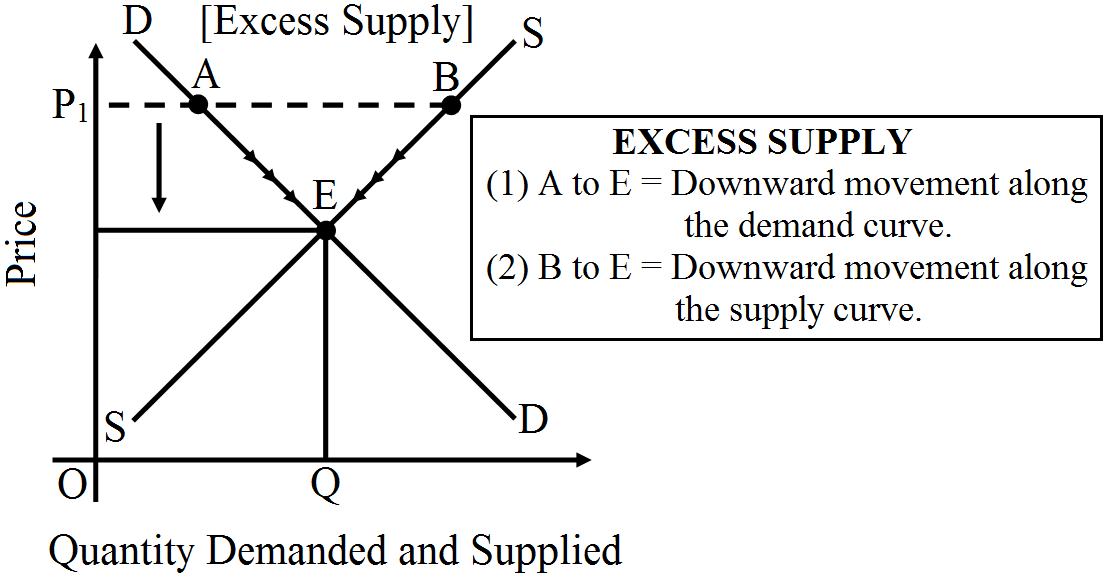
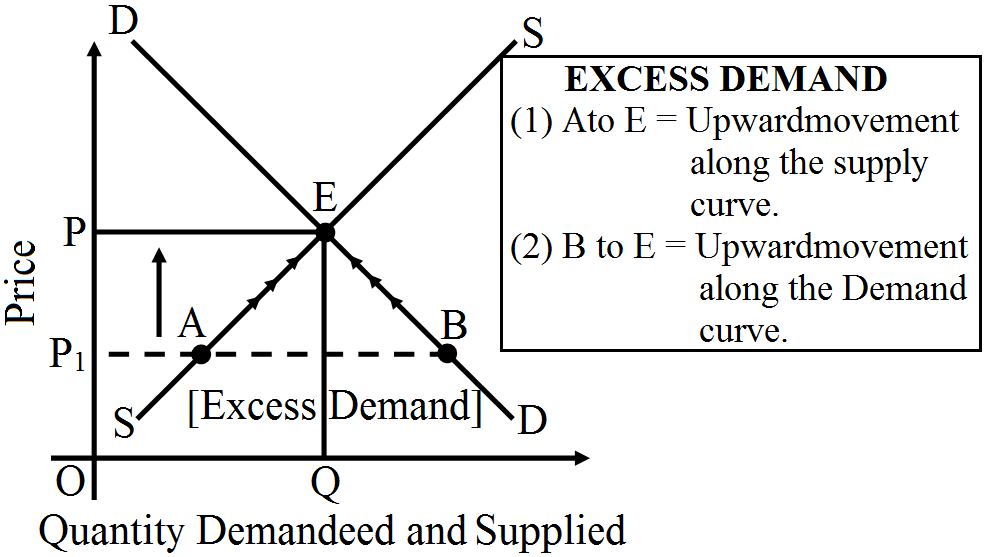
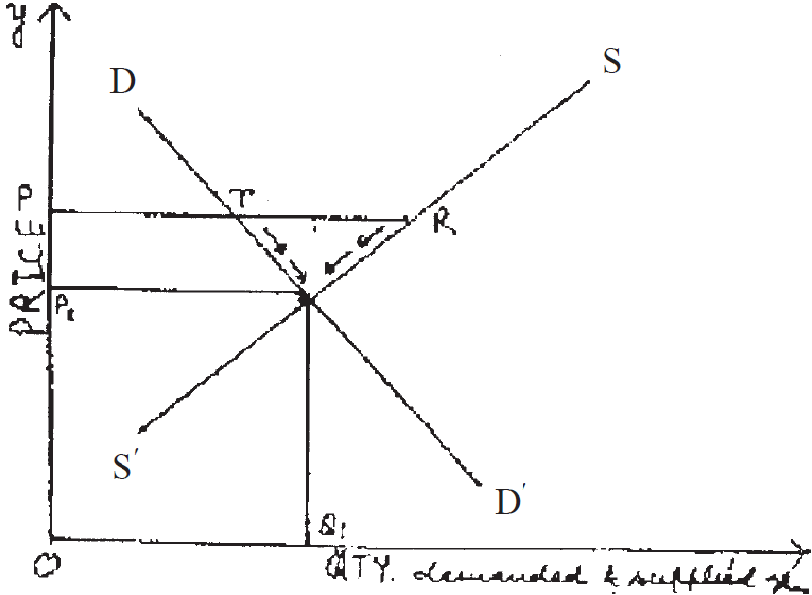
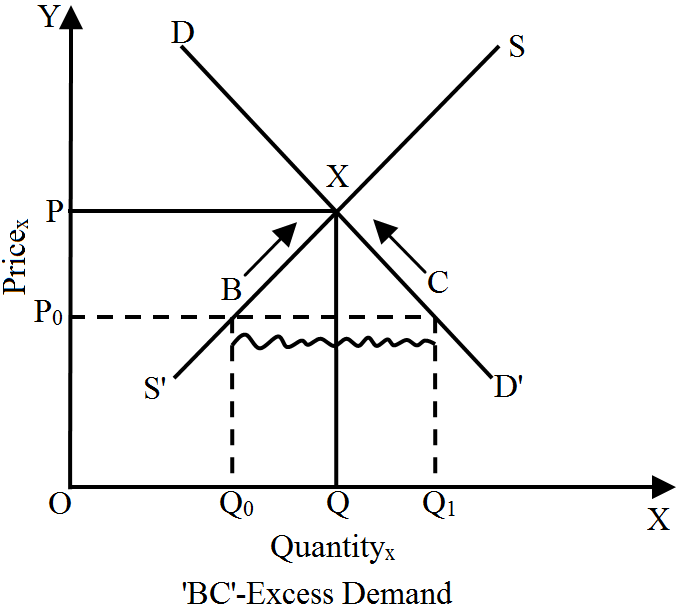
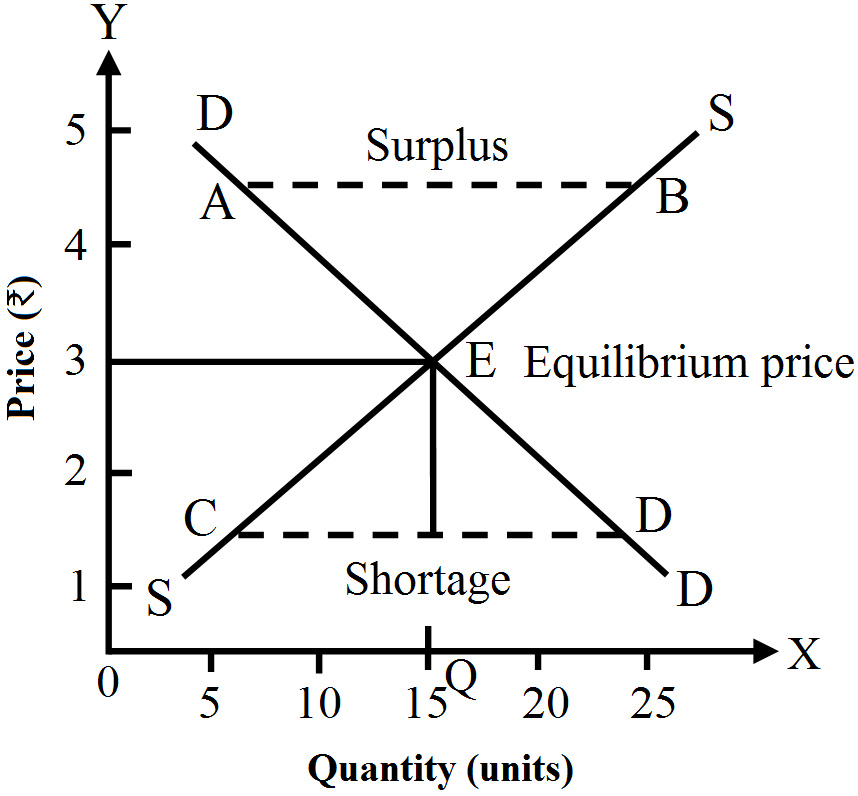
View full question & answer→When the number of firms in a perfectly competitive market is fixed, the firms are operating in the short-run. The equilibrium price is determined by the intersection of market demand curve and supply curve. It is the price at which the market demand equals market supply. In the given figure, if at any price above $P^e$, let us say Rs. $12$, there will be an excess supply, which will increase the competition among the sellers and they will reduce the price in order to sell more output. This causes a fall in the price, finally to Rs. $8 (P^e)$, where the demand equals supply. If at any price lower than $P^e$, let us say Rs. $2$, there will be an excess demand that will raise the competition among the buyers or consumers and they will be ready to pay higher price for the given output. This will increase the price to Rs. $8$ (equilibrium price), where the market will reach the equilibrium. Thus, the invisible hands of market operate automatically whenever there exist excess demand and excess supply; ensuring equilibrium in the market.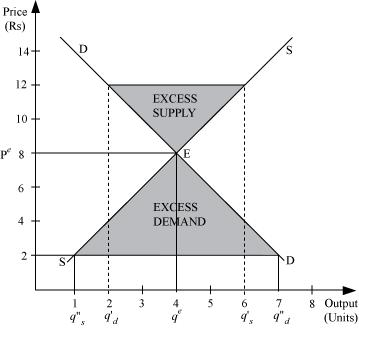
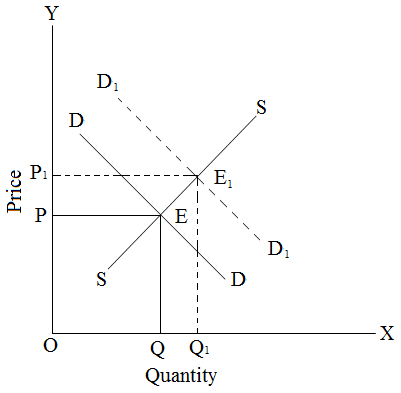
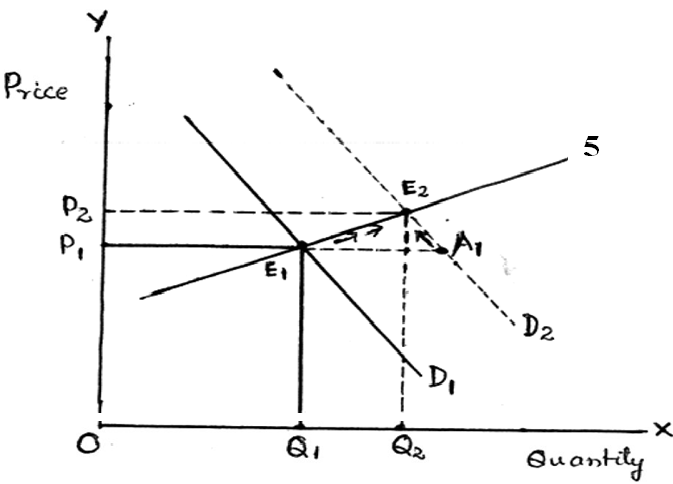
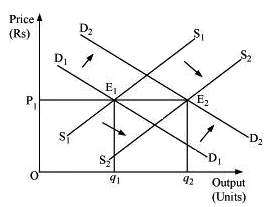
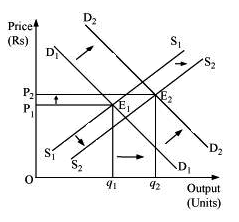
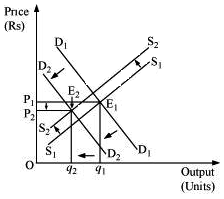
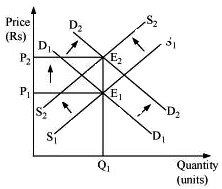
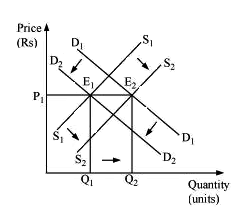
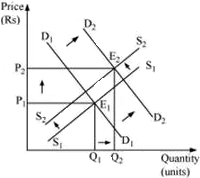
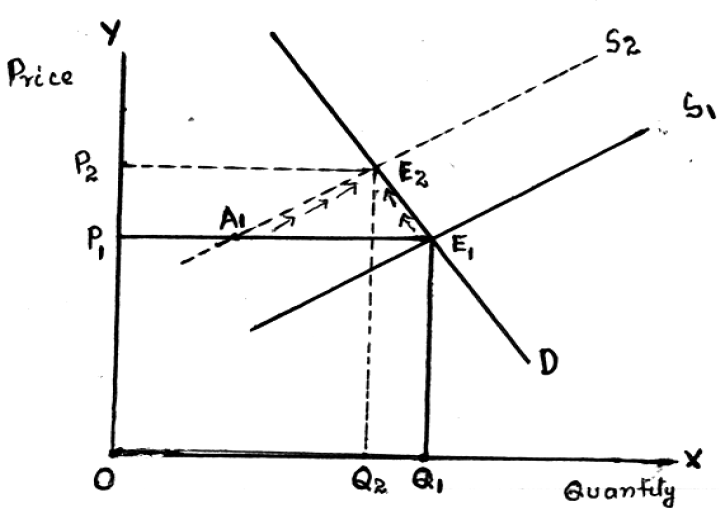
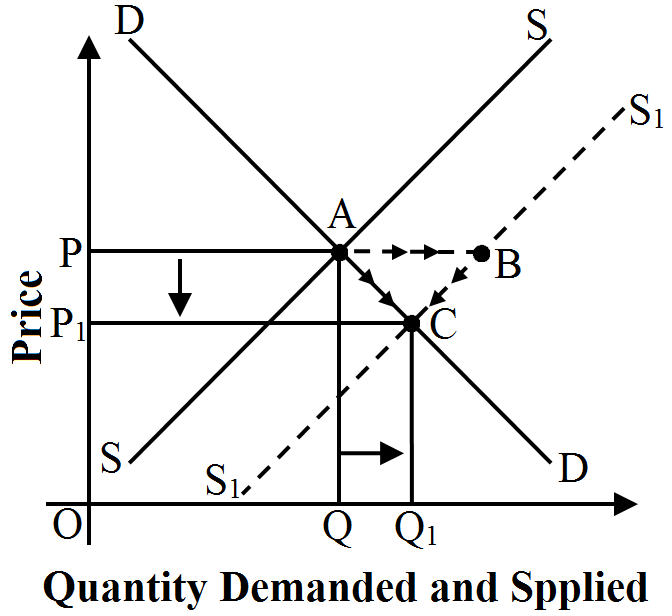
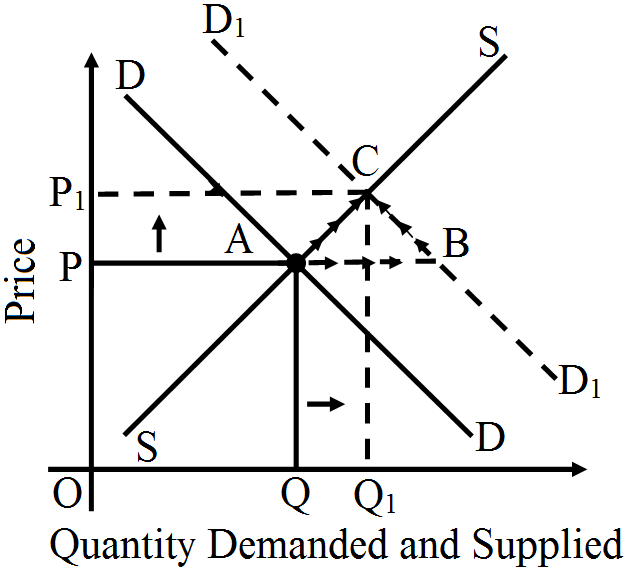
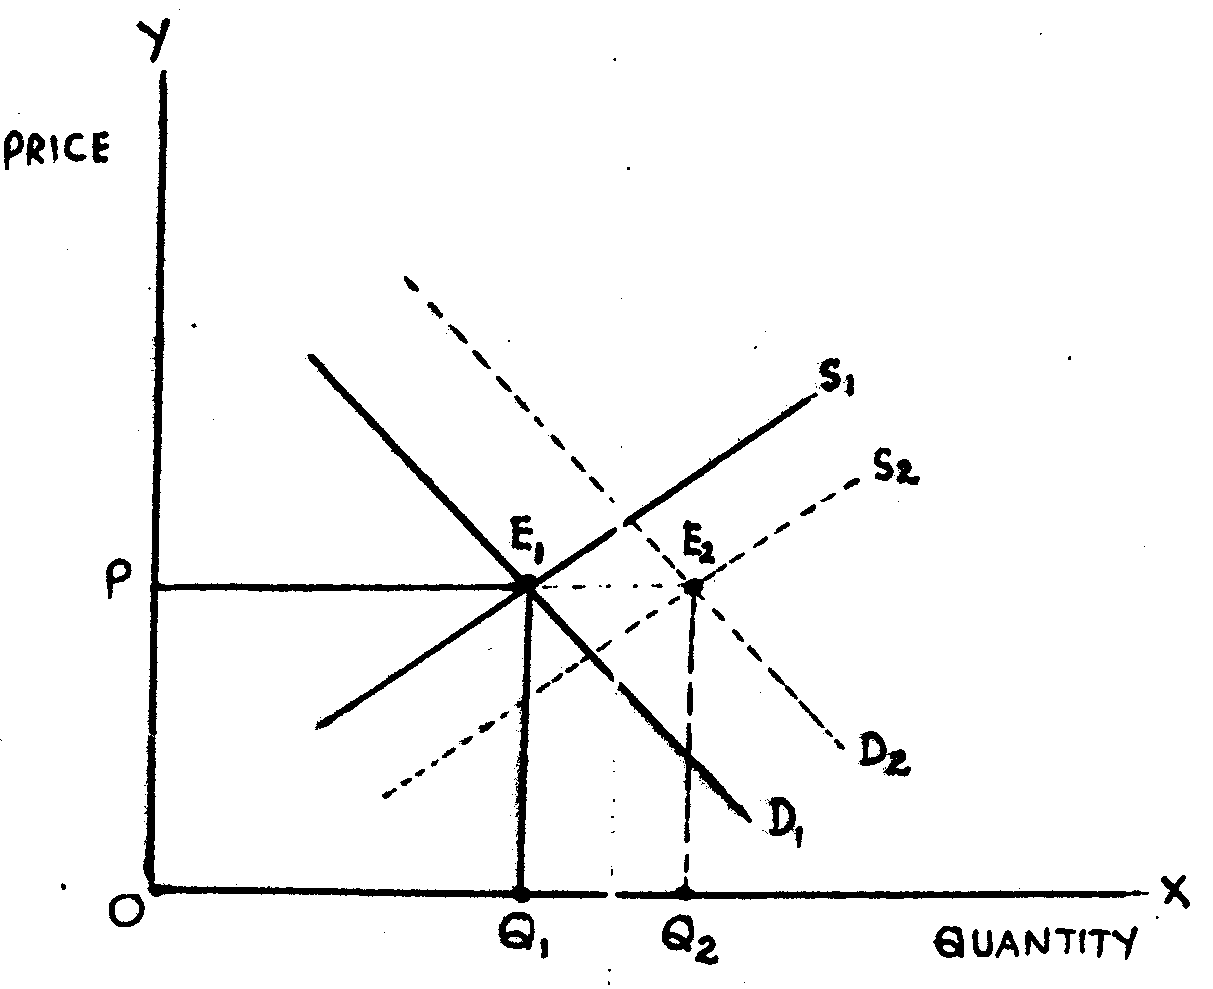
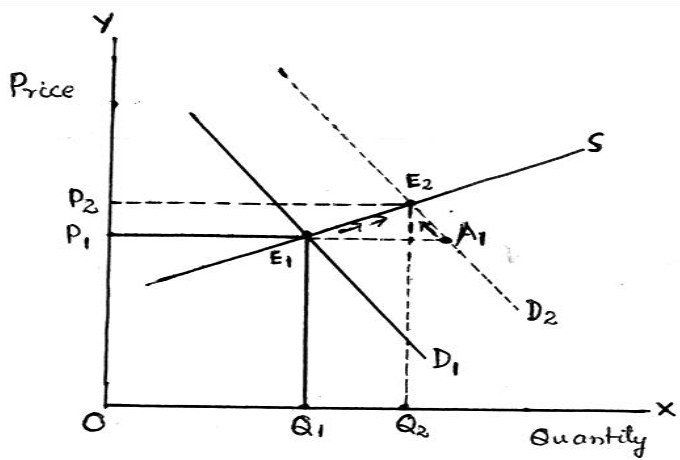
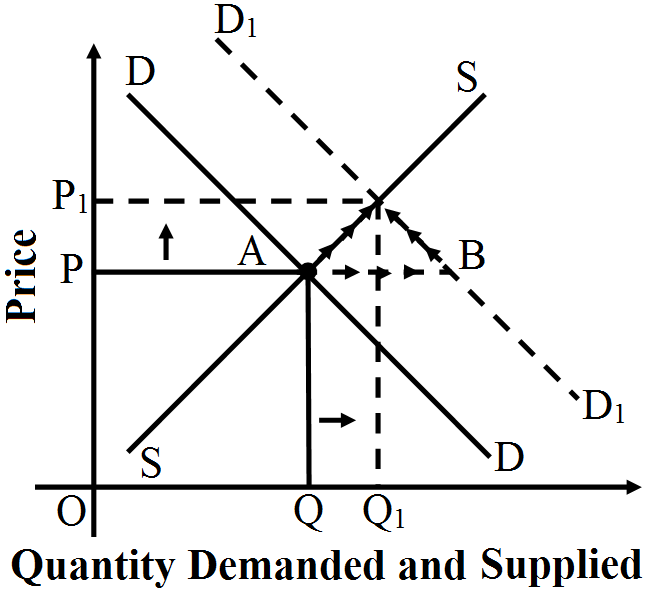
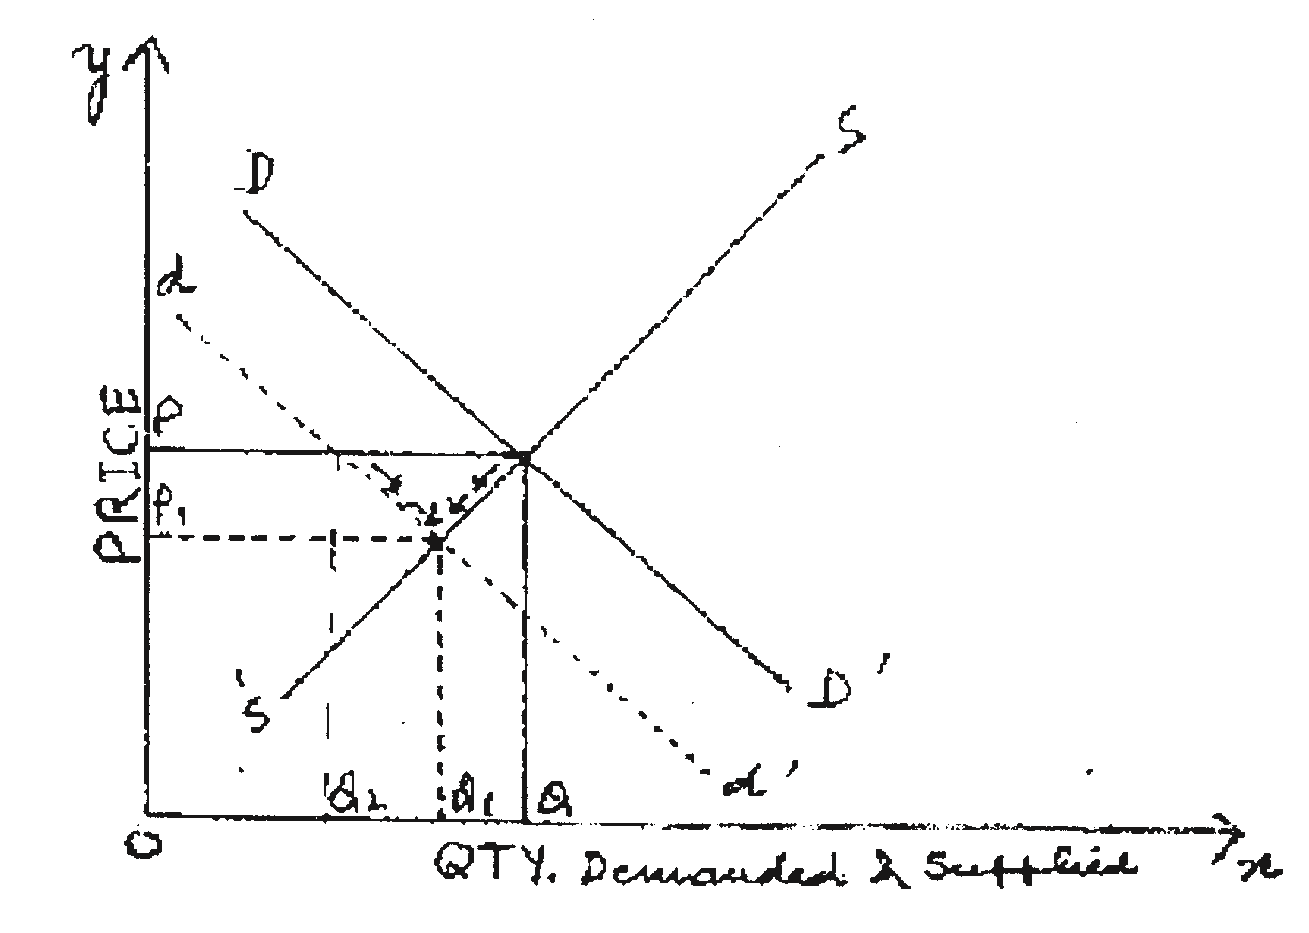
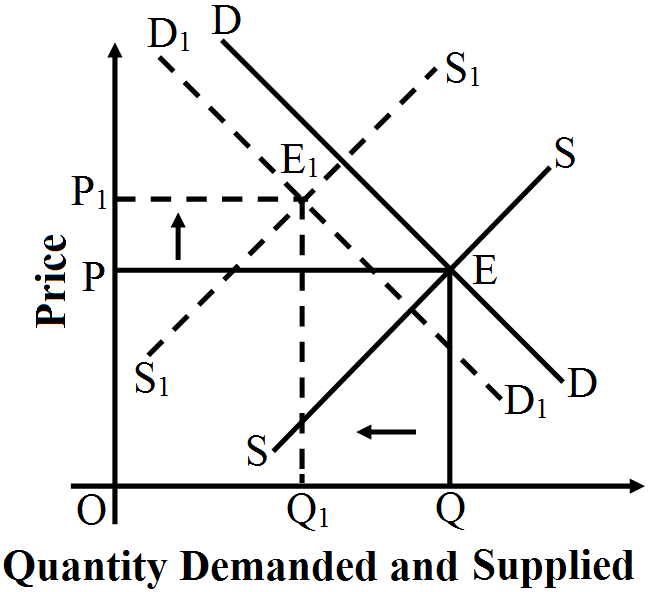
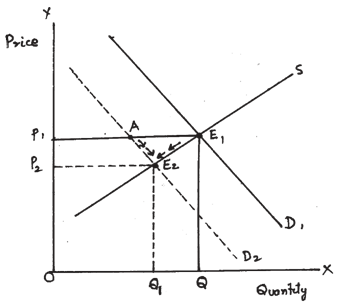
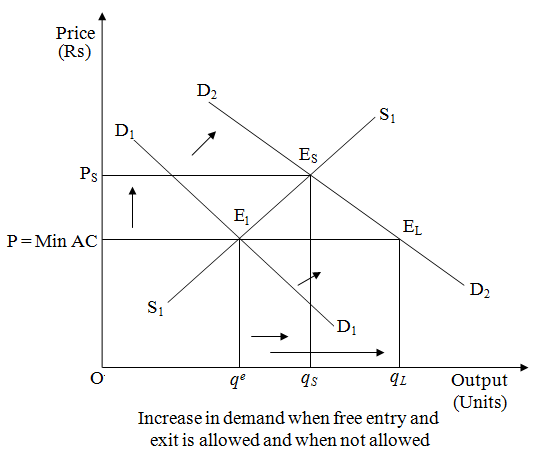 The above figure depicts the cases when the number of firms is fixed (in the short run) and when the number of firms is not fixed (in the long run). 'P = min AC' represents the long run price line, $D_1D_1$ and $D_2D_2$ represent the demands in the short run and the long run. The point $E_1$ represents the initial equilibrium where the demand curve and the supply curve intersect each other. Now, let us suppose that the demand curve shifts under the assumption that the number of firms are fixed; thus, the new equilibrium will be at $E_S$ (in the short run), where the supply curve $S_1S_1$ and the new demand curve $D_2D_2$ intersect each other. The equilibrium price is $P_S$ and equilibrium quantity is $q_S$. Now let us analyses the situation under the assumption of free entry and exit. The increase in demand will shift the demand curve rightwards to $D_2D_2$. The new equilibrium will be at $E_2$. It is the long run equilibrium with equilibrium price (P) = min AC and equilibrium quantity $q_1$. Therefore, on comparing both the cases, we find that when the firms are given the freedom of entry and exit, the equilibrium price remains same and the price is lower than the short run equilibrium price $(P_S)$; whereas, the long run equilibrium quantity $q_L$ is more than that of the short run equilibrium $(q_S)$. Similarly, for leftward demand shift, it can be noted that the short run equilibrium price $(P_S)$ is less than the long run equilibrium price and the short run equilibrium quantity $(q_S)$ is less than the long run equilibrium quantity $q_L$.
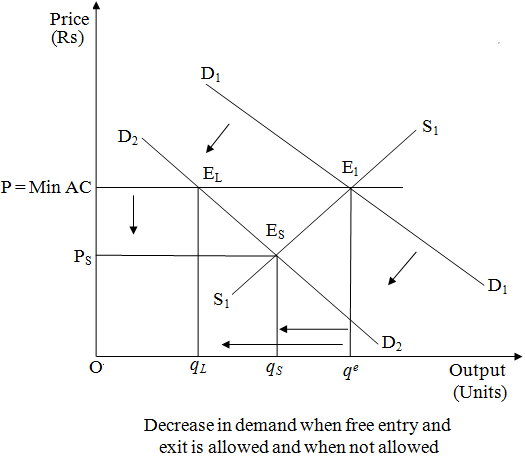
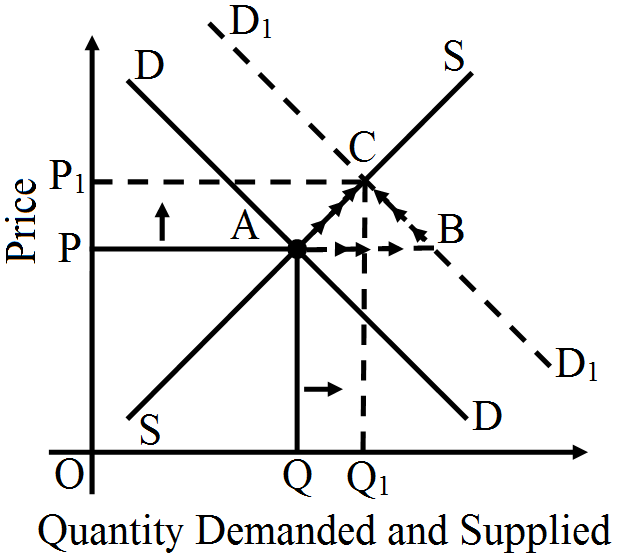
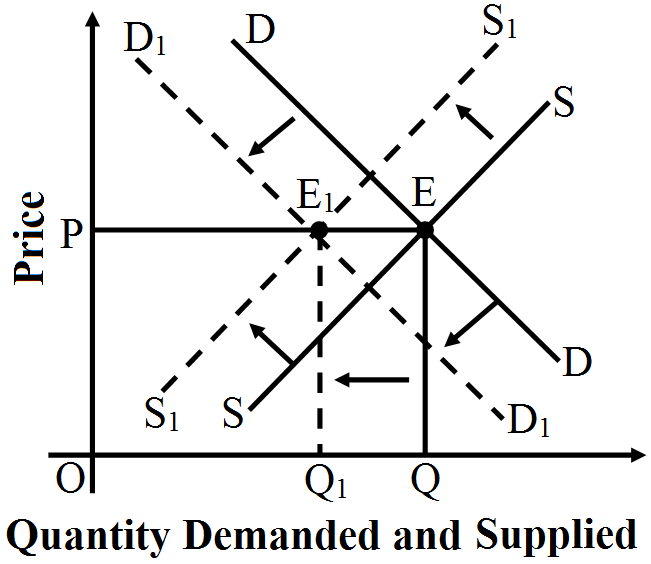
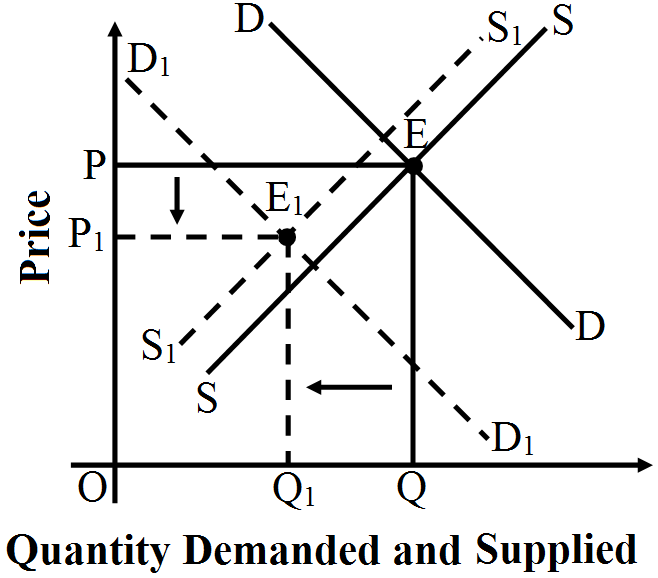
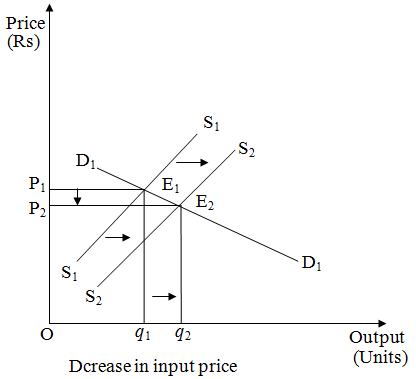
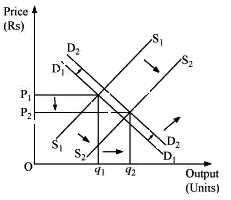
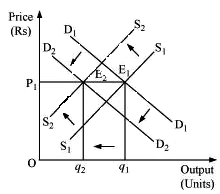
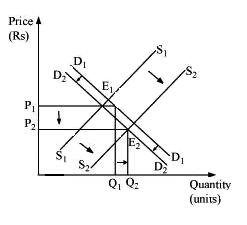
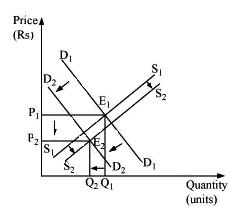
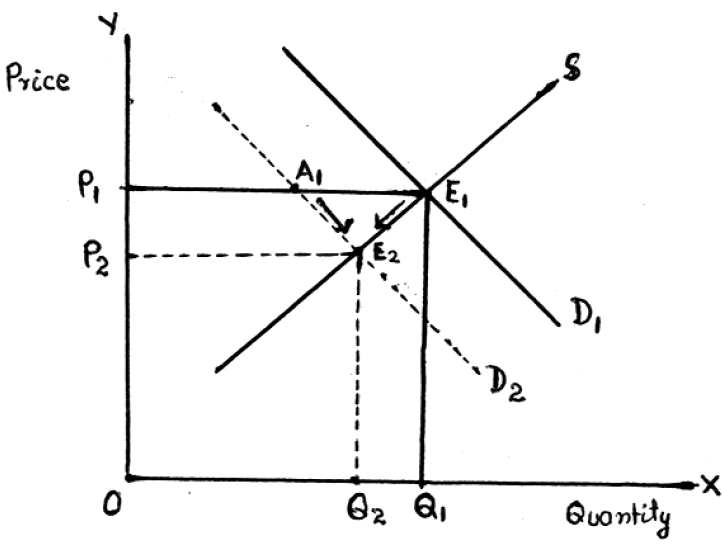
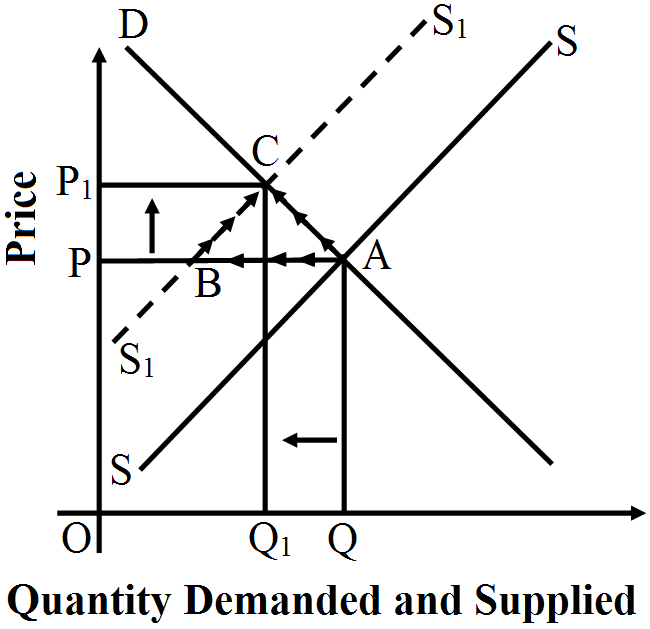
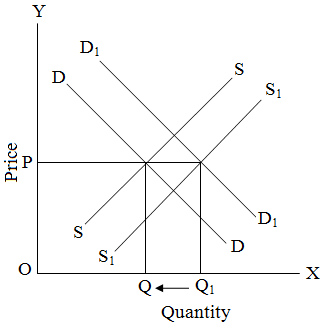
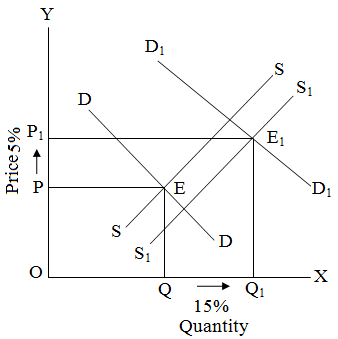
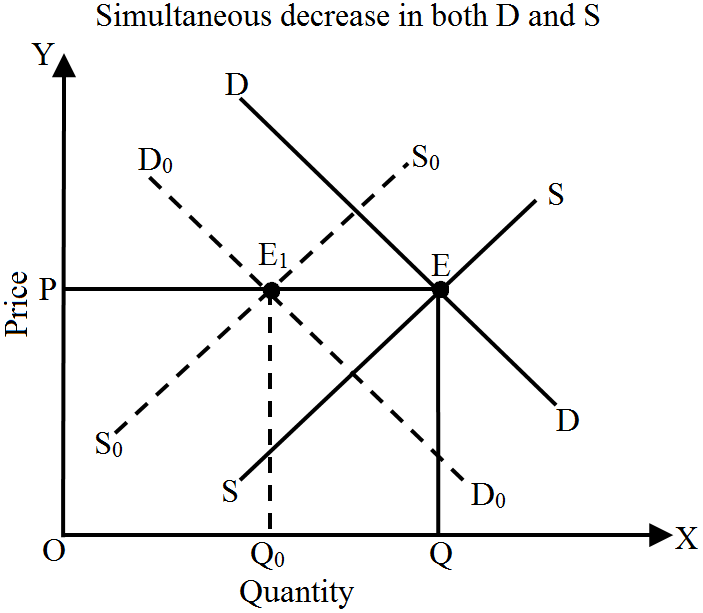
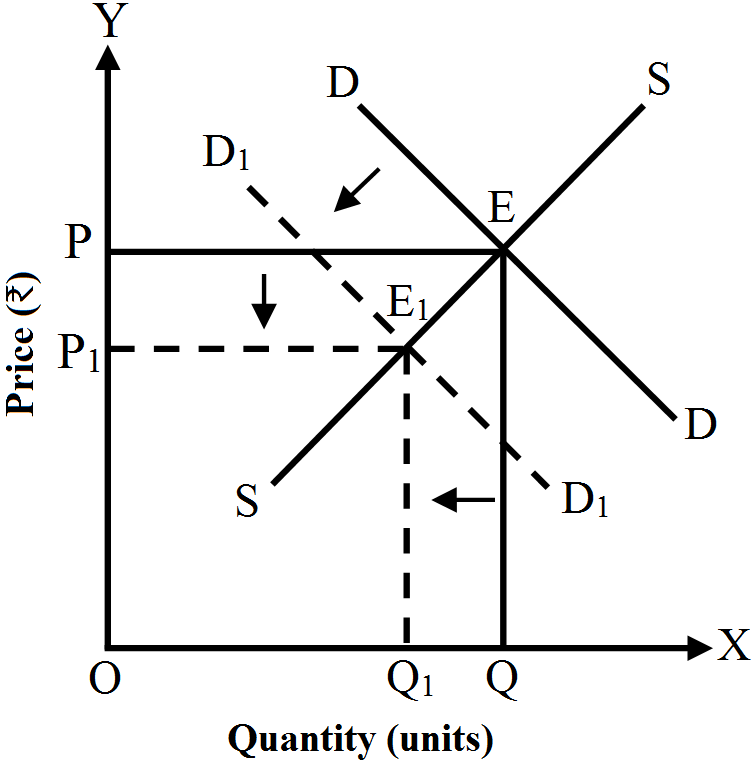
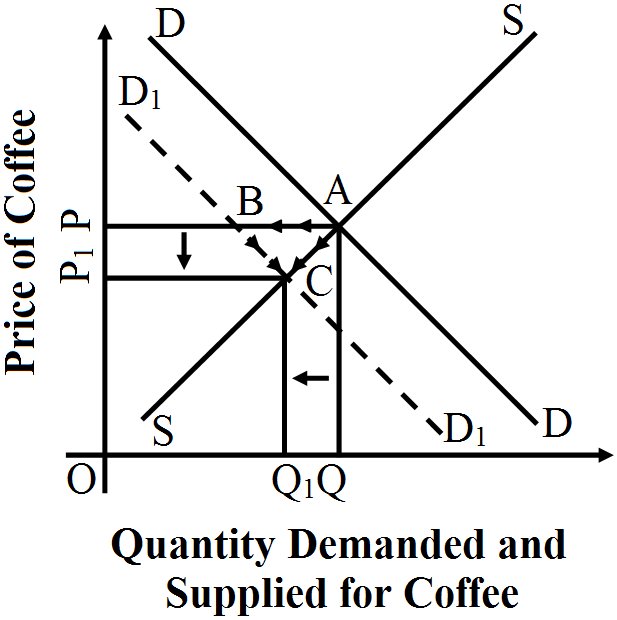
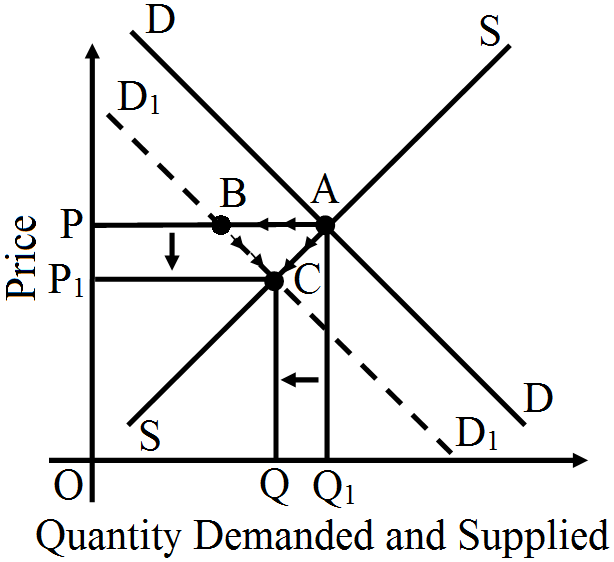
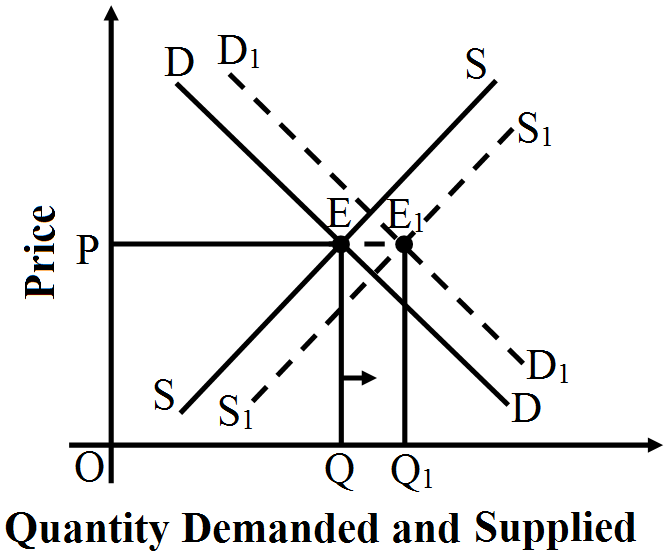
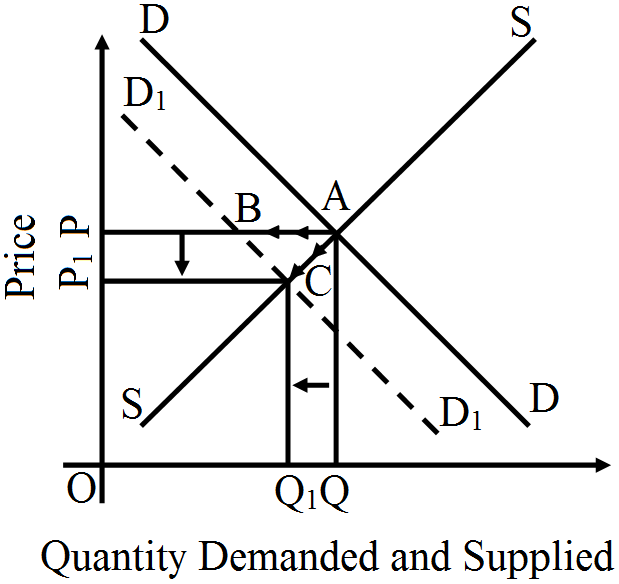
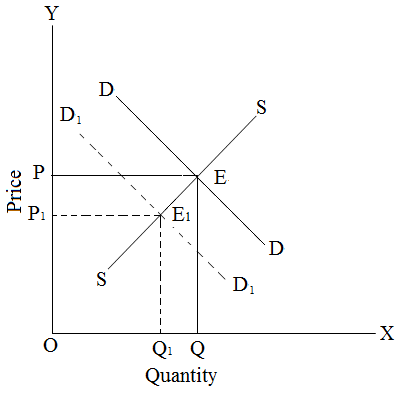
 Decrease in demand means less demand at the same price. This leads to shift of demand curve to the left from $D_1$ to $D_2$.