Question
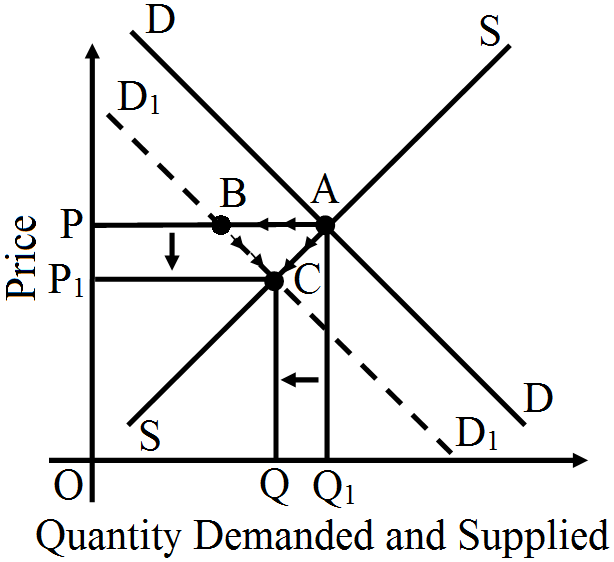
Market for a good is in equilibrium. There is decrease in demand for this good. Explain the chain of effects of this change. Use diagram.
OR
How will equilibrium price and quantity be affected when there is decrease in demand? Explain with diagram.

OR
How will equilibrium price and quantity be affected when there is leftward shift of demand curve?

OR
Explain the chain effects on demand, supply and price caused by leftward shift of demand curve.

OR
Market for a good is in equilibrium. The demand for the good ‘decreases’. Explain the chain of effects of this change.

OR
Good Y is a substitute of good X. The price of Y falls. Explain the chain of effects of this change in the market of X.

Answer

As given in the examination problem that market for a good is in equilibrium. So, we assume that initial price is OP as shown in given figure. In the given figure price is on vertical axis and quantity demanded and supplied are on horizontal axis. But due to decrease in demand, the demand curve shifts leftward from DD to $D_1D_1.$ With new demand curve $D_1D_1,$ there is excess supply at initial price OP because at price OP demand is PB and supply is PA so there is excess supply of AB at price OP. Due to this excess supply, competition among the producer will make the price fall. Due to fall in price there is downward movement along the demand curve (Expansion in demand) from B to C and similarly there is downward movement along the supply curve (contraction in supply) from A to C. So, finally, the equilibrium price falls from OP to OP, and equilibrium quantity also falls from OQ to $OQ_1.$
​​​​​​​
Conclusion: Due to decrease in demand,
  1. Equilibrium price falls from OP to $OP_1.$
  2. Equilibrium quantity also falls from OQ to $OQ_1.$

Need a full question paper?

Generate a complete, print-ready paper with questions like this in minutes — across 16+ boards, with answer keys.

Start Generating Free

Similar questions

Explain the difference between (i) inferior goods and normal goods and (ii) cardinal utility and ordinal utility. Give example in each case.
How does technological progress affect the supply curve of a firm?
A firm's average fixed cost, when it produces 2 units, is ₹ 30. Its average total cost schedule is given below. Calculate its marginal cost and average variable cost at each level of output.
Output (Units) 1 2 3
Average Total Cost (₹) 80 48 40
Distinguish between inferior good and normal good. Explain the effect of change in income on the demand curve of each good. Use diagram.
OR
Distinguish between normal goods and inferior goods, with examples.
Giving reasons, classify the following into fixed costs and variable costs.
  1. Wages to the daily wage workers.
  2. Salary of the permanent staff.
  3. Expenditure on purchase of raw materials.
  4. Interest on borrowed capital.
  5. Electricity Meter rent.
  6. Sales Tax.
What are the different phases in the Law of Variable Proportions in terms of marginal product? Give reason behind each phase. Use diagram.
How are the equilibrium price and quantity affected when:
  1. both demand and supply curves shift in the same direction?
  2. demand and supply curves shift in opposite directions?
Explain the concepts of (a) Marginal rate of substitution, (b) Budget line equation with the help of an example.
Complete the following table:
Output (Units)
Average Cost (₹)
Marginal Cost (₹)
1
12
-
2
10
-
3
-
10
4
10.5
-
5
11
-
6
-
17
On the basis of the information given below, determine the level of output at which the producer will be in equilibrium. Use the marginal cost-marginal revenue approach. Give reasons for your answer.
Output (Units) Average Revenue(₹) Total Cost(₹)
1 7 7
2 7 15
3 7 22
4 7 28
5 7 33
6 7 40
7 7 48