(a)
(a)
(b) stud.dat
(c) file.tell()
(d) file.seek(pos)
(e) pickle.dump(st,file)
(f) (iii) pickle.dump(LST,FILE)
Generate a complete, print-ready paper with questions like this in minutes — across 16+ boards, with answer keys.
DataFrame: dfzoo
| animal | uniq_id | water_need | |
| 0 | Elephant | 1001 | 500 |
| 1 | Elephant | 1002 | 600 |
| 2 | Elephant | 1003 | 550 |
| 3 | Tiger | 1004 | 300 |
| 4 | Tiger | 1005 | 320 |
| 5 | Tiger | 1006 | 330 |
| 6 | Tiger | 1007 | 290 |
| 7 | Tiger | 1008 | 310 |
| 8 | Zebra | 1009 | 200 |
| 9 | Zebra | 1010 | 220 |
| 10 | Zebra | 1011 | 240 |
| 11 | Zebra | 1012 | 230 |
| 12 | Zebra | 1013 | 220 |
| 13 | Zebra | 1013 | 100 |
| 14 | Zebra | 1014 | 80 |
| 15 | Lion | 1015 | 420 |
| 16 | Lion | 1016 | 600 |
| 17 | Lion | 1017 | 500 |
| 18 | Lion | 1018 | 390 |
| 19 | Kangaroo | 1019 | 410 |
| 20 | Kangaroo | 1020 | 430 |
| 21 | Kangaroo | 1021 | 410 |
(i) Counting all the animals
(ii) Count the number of animals in zoo
(iii) To print the sum of the water need of an animals.
(iv) To print the sum of all values.
(v) To print the sum of only numeric values.
(vi) To print the minimum values of water need.
(vii) To print the mean values of water need.
(viii) To print the median values of water need.
(ix) To print the animal wise means value.
(x) To print the mean value water need of an each animal.
As a network consultant, you have to suggest the best network related solutions for their issues/problems raised in (a) to (d), keeping in mind the distances between various locations and other given parameters.
Shortest distance between various locations:
| VILLAGE 1 to YTOWN | 2 KM |
| VILLAGE 2 to YTOWN | 1.5 KM |
| VILLAGE 3 to YTOWN | 3 KM |
| VILLAGE 1 to VILLAGE 2 | 3.5 KM |
| VILLAGE 1 to VILLAGE 3 | 4.5 KM |
| VILLAGE 2 to VILLAGE 3 | 3.5 KM |
| CITY Head Office to YHUB | 30 KM |
Number of computers installed at various locations are as follows:
| YTOWN | 100 |
| VILLAGE 1 | 10 |
| VILLAGE 2 | 15 |
| VILLAGE 3 | 15 |
| CITY OFFICE | 5 |
Note:
• In Villages, there are community centers, in which one room has been given as training center to this organization to install computers.
• The organization has got financial support from the government and top IT companies.
(a) Suggest the most appropriate location of the SERVER in the YHUB (out of the 4 locations), to get the best and effective connectivity. Justify your answer.
(b) Suggest the best wired medium and draw the cable layout (location to location) to efficiently connect various locations within the YHUB.
(c) Which hardware device will you suggest to connect all the computers within each location of YHUB?
(d) Which service/protocol will be most helpful to conduct live interactions of Experts from Head Office and people at YHUB locations?
| Ecode | Name | Age | Fav_Color | Salary |
| 101 | Rohit | 20 | Blue | 45000 |
| 102 | Mohanti | 24 | Red | 36000 |
| 103 | Tushar Koul | 23 | Green | 42000 |
| 104 | Rupali | 22 | Yellow | 38000 |
| 105 | Gurpreet | 21 | Pink | 40000 |
(a) Select the command from the given options that will give the following output:-
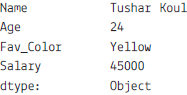
(i) print(emp.max)
(ii) print(emp.max(axis=1))
(iii) print(emp.max,axis=1)
(iv) print(emp.max())
(b) A manager wants to know the Favourite colour of the employee with the employee code 103. Help him to identify the correct set of statements from the given options:
(i) df1=emp[emp[‘Ecode’]==103]
print(df1)
(ii) df1=emp['Ecode'==103]
print(df1)
(iii) df1=emp[emp.Ecode=103]
print(df1)
(iv) df1=emp[emp.Ecode==103]
print(df1)
(c) Which of the following statement will give the names of the employees whose salary is more than 40000.
(i) print(emp.max())
(ii) print(emp[emp["Salary"]>40000])
(iii) print(emp["Salary"]>40000)
(iv) print(emp.max()>40000)
(d) Which of the following command will list only the columns Ename and Salary using loc:
(i) print(emp.loc[:,[0,2]]
(ii) print(emp.loc[:,["Ename","Salary"]])
(iii) print(emp.loc(:["Ename","Salary"]))
(iv) print(emp.loc[["Ename","Salary"]])
(e) Mr. Singh, the manager wants to add a new column, the Rank with the values ‘IV’, ‘II’, ‘III’, ‘IV’, ‘I’, to the data frame Help him to identify the right command from the followings to do so :
(i) emp.column=[‘IV’, ‘II’, ‘III’, ‘IV’, ‘I’ ]
(ii) emp.iloc["Rank"] =[‘IV’, ‘II’, ‘III’, ‘IV’, ‘I’]
(iii) emp["Rank"] =[‘IV’, ‘II’, ‘III’, ‘IV’, ‘I’ ]
(iv) None of the above
Table: Student
| Admno | Sname | Class | Sec | Fee | Mobile | Area | S_ID |
| 1001 | RAMESH | XII | A | 2500 | 987654321 | Madipur | 10 |
| 1078 | KRISHNA | XII | B | 2400 | 999911111 | Jawala Heri | 30 |
| 1006 | FARDEEN | XII | C | 2600 | 987654321 | Paschim Puri | 40 |
| 1004 | SUBHAM | XII | A | 2500 | 963025874 | Madipur | 20 |
| 1029 | KRITIKA | XI | C | 2700 | 987456210 | Madipur | 30 |
| 1008 | SAMEEKSHA | XII | A | 2450 | 987123456 | Mangol Puri | 20 |
| 1025 | SALMA | XII | B | 2580 | 998877445 | Madipur | 30 |
| 1036 | AMANDEEP | XII | B | 2600 | 999333555 | Khyala | 40 |
| 1037 | TEJAS | XI | C | 2650 | 987951357 | Paschim Puri | 40 |
| 1029 | HIMANSHU | XII | A | 2750 | 951369874 | Jawala Heri | 10 |
Table : Stream
| S_ID | Stream_name |
| 10 | MEDILCAL |
| 20 | NON MEDICAL |
| 30 | COMMERCE WITH MATH |
| 40 | COMMERCE WITH IP |
| 50 | HUMANITIES |
Write SQL commands for the statements (a) to (h) on the above table: Student and Stream
(a) Identify Primary Keys and Foreign Key in the table student and primary key in Stream table given above.
(b) Display stream id and stream-wise total fee collected.
(c) Count no of students from each area.
(d) Display all the student details those who belongs to Madipur Area.
(e) Increase the fees of all students by10%.
(f) Display unique area from the student table.
(g) Display details of those students whose area contains ‘Puri’.
(h) Display the information of those students who are in class XII and section is either B or C.
| id | name | host_id | host_name | neighbourhood_group | neighbourhood | latitude | longitude | |
| 0 | 2539 | Clean & quiet apt home by the park | 2787 | John | Brooklyn | Kensignton | 40.64749 | -73.97237 |
| 1 | 2595 | Skylit Midtown Castle | 2845 | Jennifer | Manhattan | Midtown | 40.75362 | -73.98377 |
| 2 | 3647 | The Village Of Harlem ... New York ! | 4632 | Elisabeth | Manhattan | Harlem | 40.80902 | -73.94190 |
| 3 | 3831 | Cozy Entire Floor of Brownstone | 4869 | LisaRoxanne | Brooklyn | Clinton Hill | 40.68514 | -73,95976 |
| 4 | 5022 | Entire Apt: Spacious Studio/ Loft by central park | 7192 | Laura | Manhattan | East Harlem | 40.79851 | -73.94399 |
| 5 | 5099 | Large Cozy 1BR Apartment in Midtown East | 7322 | Chris | Manhattan | Murray Hill | 40.74767 | -73.97500 |
| 6 | 5121 | BlissArtsSpace! | 7356 | Garon | Brooklyn | Bedford-Stuyvesant | 40.68688 | -7395596 |
| 7 | 5178 | Large Furnished Room Near Bway | 8967 | Shunichi | Manhattan | Hell’s Kitchen | 40.76489 | -73.98493 |
Assuming that other file is stored in CSV format named “nysc.csv” Import pandas as pd
(i) To create the Data frame of the above data.
(ii) To print the first 10 records
(iii) To display the name and Id.
Table: CARHUB
| Vcode | Vehicle Name | Make | Color | Capacity | Charges |
| 100 | Innova | Toyota | WHITE | 7 | 15 |
| 102 | SX4 | Suzuki | BLUE | 4 | 14 |
| 104 | C Class | Mercedes | RED | 4 | 35 |
| 105 | A-Star | Suzuki | WHITE | 3 | 14 |
| 108 | Indigo | Tata | SILVER | 3 | 12 |
Table: CUSTOMER
| CCode | CName | VCode |
| 1 | Hemant Sahu | 101 |
| 2 | Raj Lal | 108 |
| 3 | Feroza Shah | 105 |
| 4 | Ketan Dhal | 104 |
(a) Write SQL commands for the following statements:
(i) To display the names of all white colored vehicles
(ii) To display name of vehicle, make and capacity of vehicles in ascending order of their sitting capacity
(iii) To display the highest charges at which a vehicle can be hired from CARHUB.
(iv) To display the customer name and the corresponding name of the vehicle hired by them.
(b) Give the output of the following SQL queries:
(i) Select count(distinct make) from cabhub;
(ii) Select max(charges), min(charges) from carhub;
(iii) Select count(*), make from carhub;
(iv) Select vehiclename from carhub where capacity = 4;
Table: DEPT
| DCODE | DEPARTMENT | CITY |
| D01 | MEDIA | DELHI |
| D02 | MARKETING | DELHI |
| D03 | INFRASTRUCTURE | MUMBAI |
| D05 | FINANCE | KOLKATA |
| D04 | HUMAN RESOURCE | MUMBAI |
Table: WORKER
| WNO | NAME | DOJ | DOB | GENDER | DCODE |
| 1001 | George K | 2013-09-02 | 1991-09-01 | MALE | D01 |
| 1002 | Ryma Sen | 2012-12-11 | 1990-12-15 | FEMALE | D03 |
| 1003 | Mohitesh | 2013-02-03 | 1987-09-04 | MALE | D05 |
| 1007 | Anil Jha | 2014-01-17 | 1984-10-19 | MALE | D04 |
| 1004 | Manila Sahai | 2012-12-09 | 1986-11-14 | FEMALE | D01 |
| 1005 | R SAHAY | 2013-11-18 | 1987-03-31 | MALE | D02 |
| 1006 | Jaya Priya | 2014-06-09 | 1985-06-23 | FEMALE | D05 |
Note: DOJ refers to date of joining and DOB refers to date of Birth of workers.
(i) To display Wno, Name, Gender from the table WORKER in descending order of Wno.
(ii) To display the Name of all the FEMALE workers from the table WORKER.
(iii) To display the Wno and Name of those workers from the table WORKER who are born between ‘1987-01-01’ and ‘1991-12-01’.
(iv) To count and display MALE workers who have joined after ‘1986-01-01’.
(v) SELECT COUNT(*), DCODE FROM WORKER GROUP BY DCODE HAVING COUNT(*)>1;
(vi) SELECT DISTINCT DEPARTMENT FROM DEPT;
(vii) SELECT NAME, DEPARTMENT, CITY FROM WORKER W,DEPT D WHERE W.DCODE=D.DCODE AND WNO<1003;
(viii) SELECT MAX(DOJ), MIN(DOB) FROM WORKER;
Pawan is confused in understanding Dictionary concept. Help him to understand the concept by choosing the appropriate answer.
(a) Which statement will display Not Available?
(i) Statement 9 (ii) Statement 10
(iii) Statement 11 (iv) Statement 13
(b) Choose the key from Dictionary.
(i) ADMNO (ii) ‘admno ’
(iii) 101 (iv) “Not Available ”
(c) Which statement will display None?
(i) Statement 9 (ii) Statement 10
(iii) Statement 11 (iv) Statement 13
(d) Which Statement will display Tejas?
(i) Statement 8 (ii) Statement 9
(iii) Statement 10 (iv) Statement 11
(e) Choose the identifier.
(i) ADMNO (ii) ‘admno ’
(iii) setdefault (iv) Not Available