Question
Observe the given bar graph carefully and answer the questions that follow.
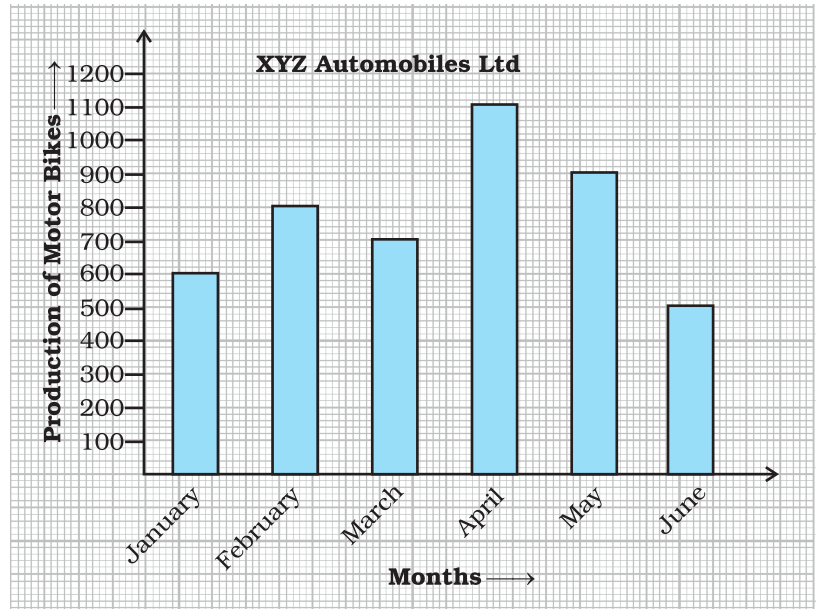
$a.$ What information does the bar graph depict?
$b.$ How many motor bikes were produced in the first three months?
$c.$ Calculate the increase in production in May over the production in January.
$d.$ In which month the production was minimum and what was it?
$e.$ Calculate the average $($mean$)$ production of bikes in $6$ months.