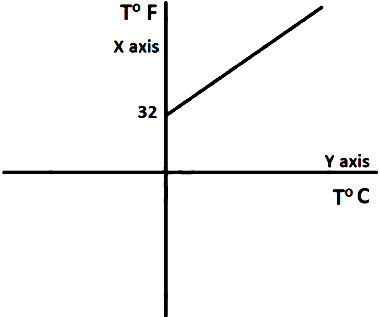
Plot a graph taking °C on the Y-axis and the corresponding °F along the X-axis.
✓
Answer
We know C/100 = (F - 32)/180. C =5/9 (F- 32 ) 9/SC + 32 = F F = 9/ SC + 32. The graph between T°F and T°C is a straight line having a slope of 9/5 and the intercept on Y-axis is 32.
Need a full question paper?
Generate a complete, print-ready paper with questions like this in minutes — across 16+ boards, with answer keys.