Question
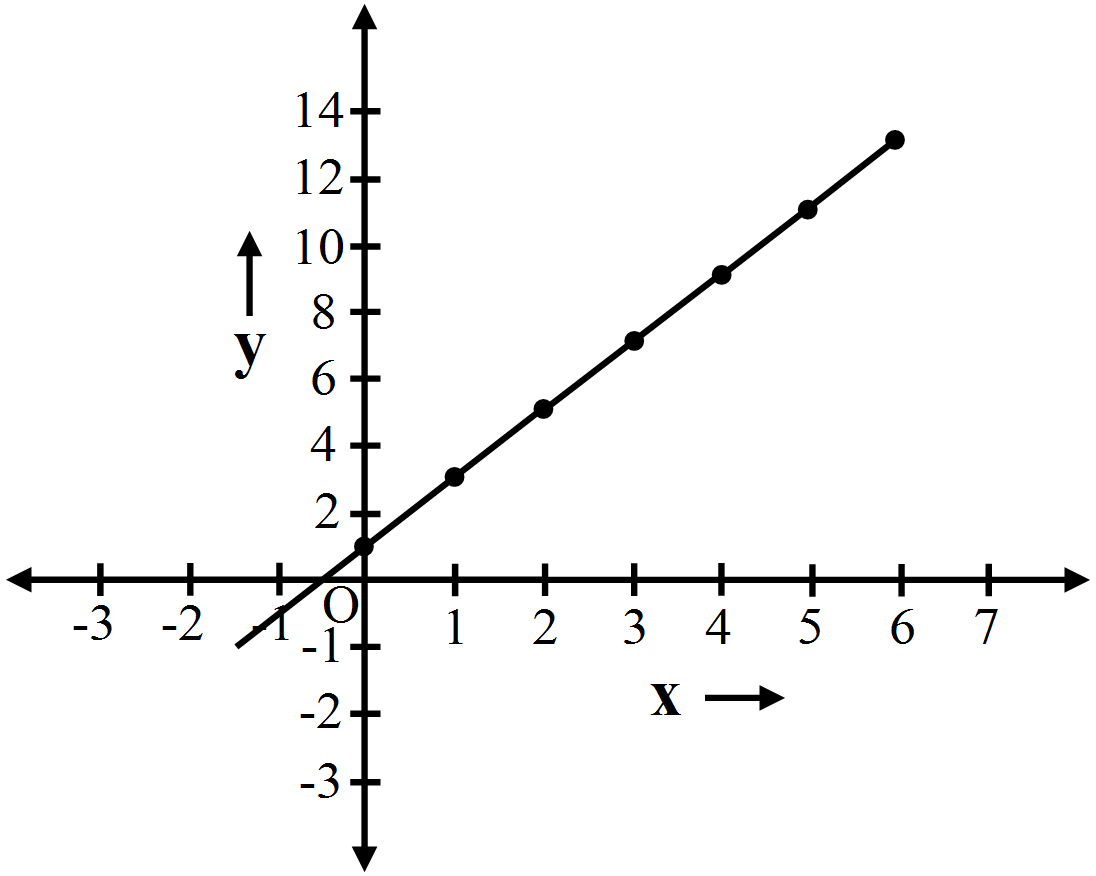
Plot a line graph for the variables $x$ and $y$ , where $y = 2x + 1$. Using the graph, find the value of.
$i. y$, when $x = 5$ and
$ii. x$, when $y = 13$
$i. y$, when $x = 5$ and
$ii. x$, when $y = 13$
|
$x$
|
$0$
|
$1$
|
$2$
|
$3$
|
$4$
|
|
$y$
|
$1$
|
$3$
|
$5$
|
$7$
|
$9$
|
Generate a complete, print-ready paper with questions like this in minutes — across 16+ boards, with answer keys.
|
|
Column $A$
|
|
Column $B$
|
|
$(1)$
|
$(0, 5)$
|
$(a)$
|
$y$ coordinate is $2 \times x - $coordinate $+\ 1$.
|
|
$(2)$
|
$(2, 3)$
|
$(b)$
|
Coordinates of origin.
|
|
$(3)$
|
$(4, 8)$
|
$(c)$
|
Only $y–$coordinate is zero.
|
|
$(4)$
|
$(3, 7)$
|
$(d)$
|
The distance from $x –$axis is $5$.
|
|
$(5)$
|
$(0, 0)$
|
$(e)$
|
$y$ coordinate is double of $x –$coordinate.
|
|
$(6)$
|
$(5, 0)$
|
$(f)$
|
The distance from $y–$axis is $2$.
|
|
$x$
|
$16$
|
$32$
|
$8$
|
$128$
|
|
$y$
|
$4$
|
$...$
|
$...$
|
$0.25$
|