Question
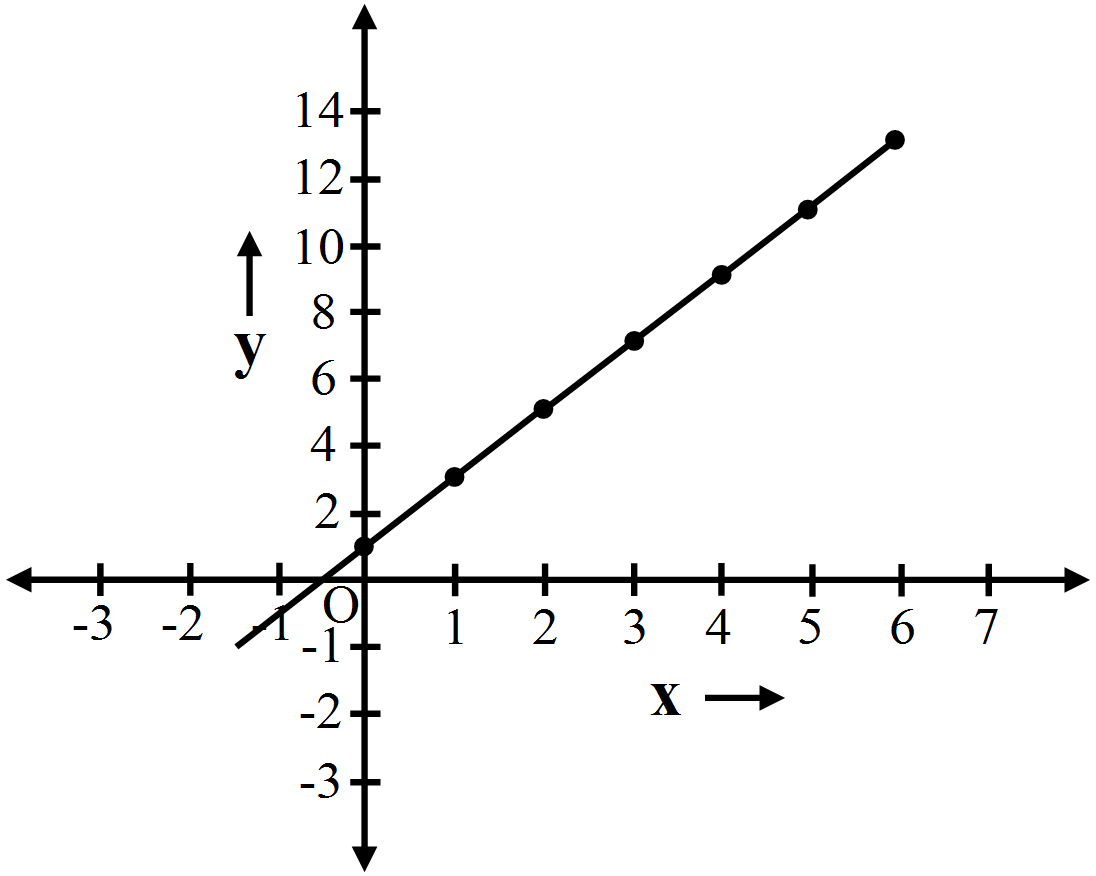
Plot a line graph for the variables x and y , where y = 2x + 1. Using the graph, find the value of.
  1. y, when x = 5 and
  2. x, when y = 13

Answer

We have the following table for y = 2x + 1
x
0
1
2
3
4
y
1
3
5
7
9

Need a full question paper?

Generate a complete, print-ready paper with questions like this in minutes — across 16+ boards, with answer keys.

Start Generating Free

Similar questions

Number of workshops organized by a school in different areas during the last five years are as follows:
Year No. of workshops
1995-1996 25
1996-1997 30
1997-1998 42
1998-1999 50
1999-2000 65
Draw a histogram representing the above data.
Draw three different triangles; a right angled triangle, an obtuse angled triangle and an acute angled triangle. Draw the medians of the triangles. Note that the centroid of each of them is in the interior of the triangle.
Solve the following equation and verify your answer:
$\frac{\text{x}^2-(\text{x}+1)(\text{x}+2)}{5\text{x}+1}=6$
$\frac{\text{x}}{2}+\frac{\text{x}}{8}=\frac{1}{8}$
Ravish has three boxes whose total weight is $60\frac{1}{2}$ kg. Box B weighs $3\frac{1}{2}$ kg. more then box A and box C weighs $5\frac{1}{3}$ kg. more than box B. Find the weight of box A.
The runs scored by a cricket team in first 15 overs are given below:
Overs: I II III IV V VI VII VIII IX X XI XII XIII XIV XV
Runs: 2 1 4 2 6 8 10 21 5 8 3 2 6 8 12
Draw the graph representing the above data in two different ways as a graph and as a bar chart.
Construct a quadrilateral ABCD given BC = 6.6cm, CD = 4.4cm, AD = 5.6cm and $\angle\text{C}=100^\circ$ and $\angle\text{C}=95^\circ.$
Rakesh lent out Rs. 10000 for 2 years at 20% per annum, compounded annually. How much more he could earn if the interest be compounded half-yearly?
Two taps A and B can fill an overhead tank in 10 hours and 15 hours respectively. Both the taps are opened for 4 hours and they B is turned off. How much time will A take to fill the remaining tank?
In the following table number of trees planted in the year 2016 and 2017 in four towns is given. Show the data with the help of subdivided bar graph.
Year\TownkarjatWadgaonShivapurKhandala
2016150250200100
2017200300250150