Question
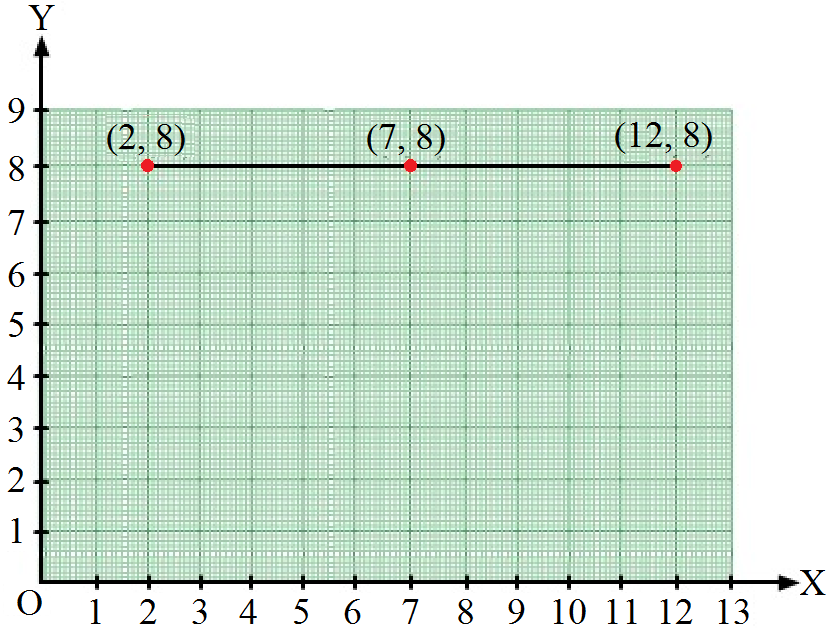
Plot the points $(2, 8), (7, 8)$ and $(12, 8)$. Join these points in pairs. Do they lie on a line? What do you observe?

Answer


Take a point $O$ on the graph paper and draw the horizontal and vertical lines $OX$ and $OY$ respectively.
Then, let on the $x$-axis and $y$ axis $1$ cm represents $1$ unit.
In order to plot point $(2,8)$, we start from the origin $O$ and move 8 cm along $O X$. The point we arrive at is $(2,8)$.
To plot point $(7,8)$, we move $7 \ cm$ along $O X$ and 8 cm along $O Y$. The point we arrive at is $(7,8)$.
To plot point $(12,8)$, we move $12 \ cm$ along $O X$ and 8 cm along $O Y$. The point we arrive at is $(12,8)$.
From the graph below, it can be seen that the points lie on a line parallel to $x$-axis because they have the same $y$-coordinate.

Need a full question paper?

Generate a complete, print-ready paper with questions like this in minutes — across 16+ boards, with answer keys.

Start Generating Free

Similar questions

$A$ and $B$ can do a piece of work in $6$ days and $4$ days respectively. $A$ started the work; worked at it for $2$0 days and then was joined by $B$. Find the total time taken to complete the work.
In a fraction, twice the numerator is $2$ more than the denominator. If $3$ is added to the numerator and to the denominator, the new fraction is $\frac{2}{3}.$ Find the original fraction.
If $a$ and $b$ vary inversely to each other, then find the values of $p, q, r ; x, y, z$ and $l, m, n.$
$a$
$6$
$8$
$q$
$50$
$b$
$18$
$p$
$39$
$r$
 
$a$
$2$
$y$
$6$
$10$
$b$
$x$
$12.5$
$15$
$z$
 
$a$
$l$
$9$
$n$
$6$
$b$
$5$
$m$
$25$
$10$
A dealer bought two tables for $Rs. 3120$. He sold one of them at a loss of $15\%$ and other at a gain of $36\%$. Then he found that each tables was sold for the same price, find the cost price of each table.
Evaluate $ \left(2.3 a^5 b^2\right) \times\left(1.2 a^2 b^2\right) $ when $a = 1$ and $b = 0.5$.
One card is drawn at random from a well$-$shuffled deck of $52$ cards. Find the probability that the card drawn is:
$i.$ A king.
$ii.$ A spade.
$iii.$ A red queen.
$iv.$ A black $8.$
In Dethi University, in the year $2009- 10,49000$ seats were available for admission to various courses at graduation level.
Out of these, 28200 seats were for the students of General category, while 7400 seats were reserved for SC and 3700 seats for ST.
Find the percentage of seats availale for
(i) students of General category.
(ii) students of SC and ST categories taken together.
Construct a frequency table with equal class intervals from the following data on the monthly wages (in rupees) of $28$ labourers working in a factory, taking one of the class intervals as $210-230 (230$ not included$): 220, 268, 258, 242, 210, 268, 272, 242, 311, 290, 300, 320, 319, 304, 302, 318, 306, 292, 254, 278, 210, 240, 280, 316, 306, 215, 256, 236.$
The monthly income of family is $₹ 28800$. The monthly expenditure of the family on various items is given below.
Item Rent Food Clothing Education Saving
Expenditure $($in $₹)$ $8000$ $10800$ $5600$ $3600$ $800$
Represent the above data by a pie chart.
By what numbers should the following be divided to get a perfect square in case? Also, find the number whose square is the new number.
$16562$