Questions

5 Marks Questions

Take a timed test

13 questions · self-marked practice — reveal the answer and mark yourself.

Question 15 Marks
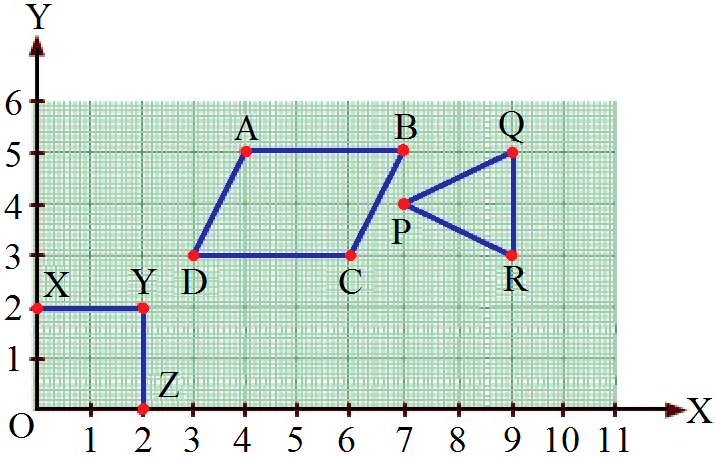
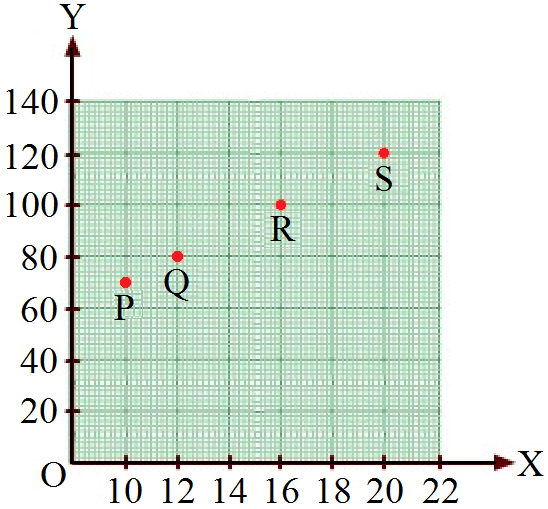
Find the coordinates of points $P, Q, R$ and $S$ in Figure.
Answer

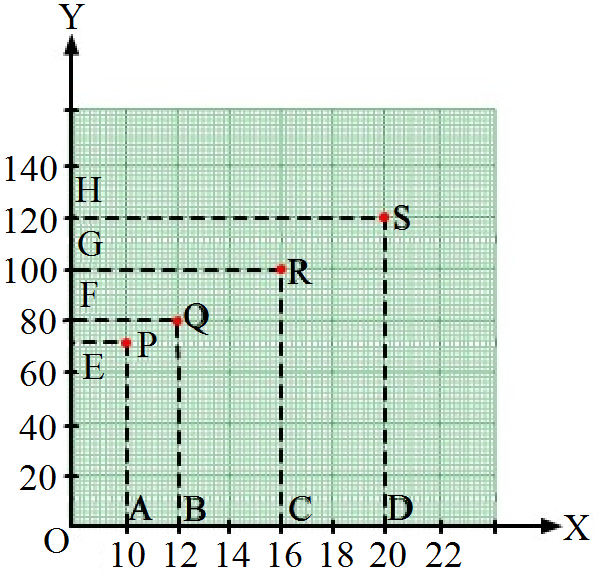
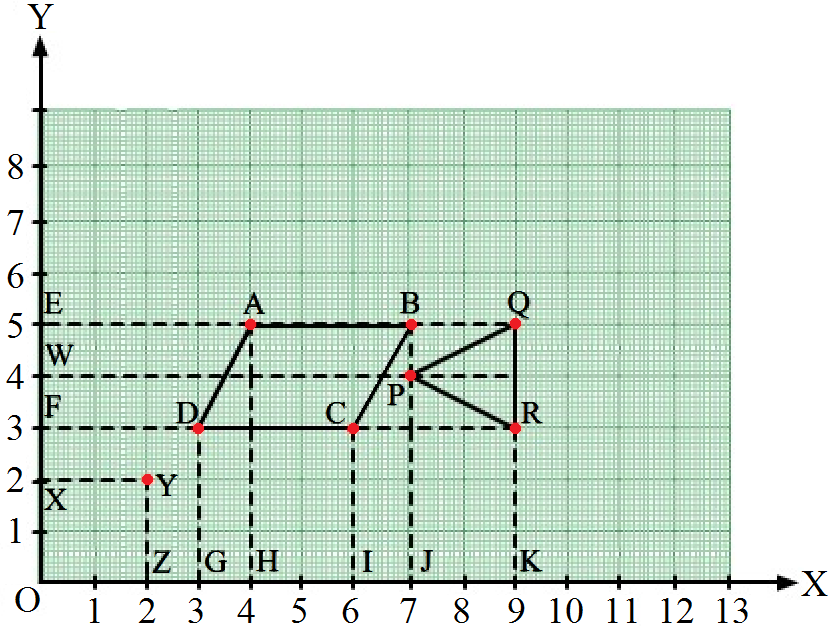
Draw perpendiculars $PA, QB, RC$ and $SD$ from vertices $P, Q, R$ and $S$ on the $x-$axis.
Also ,draw perpendiculars.
$PE, QF, RG$ and $SH$ on the $y-$axis from these points.
$PE = 10$ units and $PA = 70$ units.
Therefore, the coordinates of vertex $P$ are $(10, 70).$
$QF = 12$ units and $QB = 80$ units
Therefore, the coordinates of vertex $Q$ are $(12, 80).$
$RG = 16$ units and $RC = 100$ units
Therefore, the coordinates of vertex $R$ are $(16, 100).$
$SH = 20$ units and $SD = 120$ units
Therefore, the coordinates of vertex $S$ are $(20, 120).$
View full question & answer
Question 25 Marks
The runs scored by a cricket team in first $15$ overs are given below:
Overs: $I$ $II$ $III$ $IV$ $V$ $VI$ $VII$ $VIII$ $IX$ $X$ $XI$ $XII$ $XIII$ $XIV$ $XV$
Runs: $2$ $1$ $4$ $2$ $6$ $8$ $10$ $21$ $5$ $8$ $3$ $2$ $6$ $8$ $12$
Draw the graph representing the above data in two different ways as a graph and as a bar chart.
Answer


Here, over is an independent variable and run is a dependent variable.
So, we take overs on the $x-$axis and runs the on $y-$axis.
Let us choose the following scale:
On $x-$​​​​​​​axis: $1cm = 1$ over
On $y-$axis: $1\ cm = 2$ runs
Now, let us plot $\ce{(I, 2), (II, 1), (III, 4), \_\_\_\_\_, (XV, 12)}$. These points are joined to get the graph representing the given information as shown in the figure below.
View full question & answer
Question 35 Marks
The following table shows the number of patients discharged from a hospital with $\text{HIV}$ diagnosis in different years:
Years: $2002$ $2003$ $2004$ $2005$ $2006$
Number of patients: $150$ $170$ $195$ $225$ $230$
Answer

Here, years is an independent variable and the number of patients is a dependent variable.
So, we take years on the $x-$axis and the number of patients on the $y-$axis.
Let us choose the following scale:
On $x-$axis: $2\ cm = 1$ year
On $y-$​​​​​​​axis: $1\ cm = 10$ patients
Also, let us assume that on the $x-$axis, origin $(O)$ represents $2001$ and on the $y-$axis, origin $(O)$ represents $120$,
i.e. $O (2001, 120).$
Now, let us plot $(2002, 150), (2003, 170), (2004, 195), (2005, 225), (2006, 230).$
These points are joined to get the graph representing the given information as shown in the figure below.
View full question & answer
Question 45 Marks
The runs scored by two teams $A$ and $B$ in first $10$ overs are given below:
Overs: $I$ $II$ $III$ $IV$ $V$ $VI$ $VII$ $VIII$ $IX$ $X$
Team A: $2$ $1$ $8$ $9$ $4$ $5$ $6$ $10$ $6$ $2$
Team B: $5$ $6$ $2$ $10$ $5$ $6$ $3$ $4$ $8$ $10$
Draw a graph depicting the data, making the graphs on the same axes in each case in two different ways as a graph and as a bar chart.
Answer


Here, over is an independent variable and run is a dependent variable.
So, we take overs on $x-$axis and runs on $y-$axis.
Let us choose the following scale:
On $x-$axis: $1cm = 1$ over.
On $y-$axis: $1cm = 1$ run.
Now, let us plot $\ce{(I, 2), (II, 1), (III, 8),}$
$\_\_\_\ ,(\ce{X, 2})$ for team $A$ and $\ce{(I, 5), (II, 6), (III, 8), \_\_\_\ (X, 10)}$ for team $B$. These points are joined to get the graph representing the given information as shown in the figure below.​
View full question & answer
Question 55 Marks
Locate the points:
$1. (1, 1), (1, 2), (1, 3), (1, 4)$
$2. (2, 1), (2, 2), (2, 3), (2, 4)$
$3. (1, 3), (2, 3), (3, 3), (4, 3)$
$4. (1, 4), (2, 4), (3, 4), (4, 4).$
Answer
$i.$ In order to plot these points, the given steps are to be followed:
Take a point $O$ on a graph paper and draw horizontal and vertical lines $OX$ and $OY$ respectively.
Then, let on $x-$axis and $y$ axis $1\ cm$ represents $1$ unit.
In order to plot point $(1, 1)$, we start from the origin $O$ and move $2\ \ cm$ along $OX$ and $1\ \ cm$ along $OY$. The point we arrive at is $(1, 1).$
To plot point $(1, 2)$, we move $1\ cm$ along $OX$ and $2\ cm$ along $OY.$ The point we arrive at is $(1, 2).$
To plot point $(1, 3)$, we move $1\ cm$ along $OX$ and $3\ cm$ along $OY.$ The point we arrive at is $(1, 3).$
To plot point $(1, 4)$, we move $1\ cm$ along $OX$ and $4\ cm$ along $OY.$ The point we arrive at is $(1, 4).$

$ii.$ Follow the steps mentioned in point $(i).$
​​​​​​
$iii.$ Follow the steps mentioned in point $(i).$

$iv.$ Follow the steps mentioned in point $(i).$
View full question & answer
Question 65 Marks
The following table shows the sales of a commodity during the years $2000$ to $2006.$
Years: $2000$ $2001$ $2002$ $2003$ $2004$ $2005$ $2006$
Sales $($in lakhs of $Rs):$ $1.5$ $1.8$ $2.4$ $3.2$ $5.4$ $7.8$ $8.6$
Draw a graph of this information.
Answer

Here, year is an independent variable and sales is a dependent variable.
So, we take year on the $x-$axis and sales on the $y-$axis.
Let us choose the following scale:
On $x-$axis: $2\ cm = 1$ year
On $y-$axis: $2\ cm = 1$ lakh rupees
Assume that on $x-$axis, origin $(O)$ represents $1991.$
So, the coordinates of $O$ are $(1991, 0)$.
Now, let us plot $(2000, 1.5), (2001, 1.8), (2002, 2.4), (2003, 3.2), (2004, 5.4), (2005, 7.8)$ and $(2006, 8.6)$.
These points are joined to get the graph representing the given information as shown in the figure below.​
View full question & answer
Question 75 Marks
The following table gives the information regarding length of a side of a square and its area:
Length of a side $($in $cm):$ $1$ $2$ $3$ $4$ $5$
Area of square $($in $cm ^2 ):$ $1$ $4$ $9$ $16$ $25$
Draw a graph to illustrate this information.
Answer

Here, length of a side is an independent variable and area of square is a dependent variable.
So, we take length of a side on the $x-$axis and area of square on the $y-$axis.
Let us choose the following scale:
On $x-$axis: $2\ cm = 1\ cm$
On $y-$axis: $1\ cm = 2\ cm^2$
Now we plot $(1, 1), (2, 4), (3, 9), (4, 16), (5, 25).$ These points are joined to get the graph representing the given information as shown in the figure below.​
View full question & answer
Question 85 Marks
The following table shows the amount of rice grown by a farmer in different years:
Years: $2000$ $2001$ $2002$ $2003$ $2004$ $2005$ $2006$
Rice grown (in quintals): $200$ $180$ $240$ $260$ $250$ $200$ $270$
Answer

Here, year is an independent variable and quantity of rice grown is a dependent variable.
So, we take years on the $x-$axis and quantity of rice grown on the $y-$axis.
Let us choose the following scale:
On $x-$axis: $2\ cm = 1$ year.
On $y-$axis: $1\ cm = 20$ quintals.
Let us assume that the origin $O$ represents the coordinates $(1999, 160).$
Now, let us plot $(2000, 200), (2001, 180), (2002, 240), (2003, 260), (2004, 250),(2005, 200),(2006, 270)$.
These points are joined to get the graph representing the given information as shown in the figure below.​
View full question & answer
Question 95 Marks
Draw the velocity-time graph from the following data:
Time $($in hours$):$ $7:00$ $8:00$ $9:00$ $10:00$ $11:00$ $12:00$ $13:00$ $14:00$
Speed $($in $km/ hr):$ $30$ $45$ $60$ $50$ $70$ $50$ $40$ $45$
Answer


Here, time is an independent variable and speed is a dependent variable.
So, we take time on the $x-$axis and speed on the $y-$axis.
Let us choose the following scale:
On $x-$axis: $2$ big division $= 1$ hour
On $y-$axis: $1$ big division $= 10\ km/ hr$
Let us assume that on the $x-$axis, the coordinate of origin $(O)$ is $7:00.$
So, the coordinates of $O$ are $(7:00,0).$
Now, let us plot $(7:00, 30), (8:00, 45), (9:00, 60), (10:00, 50), (11:00, 70), (12:00, 50), (13:00, 40), (14:00, 45).$
These points are joined to get the graph representing the given information as shown in the figure below.​
View full question & answer
Question 105 Marks
Draw the temperature$-$time graph in each of the following cases:
Time $($ in hours$):$ $7:00$ $8:00$ $9:00$ $10:00$ $11:00$ $12:00$ $13:00$ $14:00$
Speed $($ in $km/hr):$ $30$ $45$ $60$ $50$ $70$ $50$ $40$ $45$
 
Time $($in hours$):$ $8:00$ $10:00$ $12:00$ $14:00$ $16:00$ $18:00$ $20:00$
Temperature $(^\circ F)$ in: $100$ $101$ $104$ $103$ $99$ $98$ $100$
Answer
$i. $

$ii. $

Here, time is an independent variable and temperature is a dependent variable.
So, we take time on the $x-$axis and temperature on the $y-$axis.
Let us choose the following scale:
For point $(i):$
On $x-$axis: $1\ cm = 1$ hours
On $y-$axis: $1\ cm = 2^{\circ} F$
​​​​​​​​For point $(ii):$
On $x-$axis: $2\ cm = 2$ hours
On $y-$axis: $1\ cm = 1^{\circ} F$
Let us assume that on the $x-$axis, the coordinate of origin is $6:00.$
On $y-$axis, the coordinate of origin is $94^{\circ} F$ .
So, the coordinates of $O$ are $(6:00, 94).$
Now, let us plot $(7:00, 100), (9:00, 101), (11:00, 104), \_\_\_\_\ (21:00, 98)$ for point $(i)$ and $(8:00, 100), (10:00, 101), (12:00, 104), \ \_\_\_\_\ , (20:00, 100)$ for point $(ii).$ These points are joined to get the graphs representing the given information as shown in the figures below.​
View full question & answer
Question 115 Marks
Write the coordinates of each of the vertices of each polygon in Figure.
Answer


From the figure:
We have:
In polygon $\text{OXYZ:}$
$O$ lies on the origin and the coordinates of the origin are $(0, 0)$. So, the coordinates of $O$ are $(0, 0)$.
$X$ lies on the $y-$axis. So, the $x-$coordinate is $0$. Hence, the coordinate of $X$ is $(0, 2)$.
Also, $YX$ is equal to $2$ units and $YZ$ is equal to $2$ units. So, the coordinates of vertex $Y$ are $(2, 2)$.
$Z$ lies on the $x-$axis. So, the $y-$coordinate is $0$. Hence, the coordinates of $Z$ are $(2, 0)$.
In polygon $\text{ABCD:}$
Draw perpendiculars $\text{DG, AH, CI}$ and $\text{BJ}$ from $\text{A, B, C}$ and $D$ on the $x-$axis.
Also, draw perpendiculars $\text{DF, AE, CF}$ and $\text{BE}$ from $\text{A, B, C}$ and $D$ on the $y-$axis.
Now, from the figure:
$\text{DF} = 3$ units and $\text{DG} = 3$ units
Therefore, the coordinates of $D$ are $(3, 3)$.
$\text{AE} = 4$ units and $\text{AH} = 5$ units
Therefore, the coordinates of $A$ are $(4, 5)$.
$\text{CF} = 6$ units and $\text{CI} = 3$ units
Therefore, the coordinates of $C$ are $(6, 3)$.
$\text{BE} = 7$ units and $\text{BJ} = 5$ units
Coordinates of $B$ are $(7, 5)$.Therefore, the $c$
In polygon $\text{PQR:}$
Draw perpendiculars $\text{PJ, QK}$ and $\text{RK}$ from $\text{P, Q}$ and $R$ on the $x-$axis.
Also, draw perpendiculars $\text{PW, QE}$ and $\text{RF}$ from $P, Q$ and $R$ on the $y-$axis.
Now, from the figure:
$\text{PW} = 7$ units and $\text{PJ} = 4$ units
Therefore, the coordinates of $P$ are $(7, 4)$.
$\text{QE} = 9$ units and $\text{QK} = 5$ units
Therefore, the coordinates of $Q$ are $(9, 5)$.
$\text{RF} = 9$ units and $\text{RK} = 3$ units
Therefore, the coordinates of $R$ are $(9, 3)$.
View full question & answer
Question 125 Marks
Plot the points $(5, 0), (5, 1), (5, 8)$. Do they lie on a line? What is your observation?
Answer
i. Take a point $O$ on the graph paper and draw horizontal and vertical lines $O X$ and $O Y$ respectively.
ii. Then, let on the $x$-axis and $y$ axis $1$ cm represents $1$ unit.
iii. In order to plot point $(5,0)$, we start from the origin $O$ and move $5$ cm along $O X$. The point we arrive at is point $(5,0)$.
iv. To plot point $(5,1)$, we move $5$ cm along $O X$ and $1$ cm along $O Y$. The point we arrive at is point $(5,1)$.
v. To plot point $(5,8)$, we move $5$ cm along $O X$ and $8$ cm along $O Y$. The point we arrive at is point $(5,8)$.
vi. From the graph below, it can be seen that the points lie on a line parallel to $y$-axis. This is because they have the same $x$-coordinate. $x-$coordinate.
View full question & answer
Question 135 Marks
Plot the points $(2, 8), (7, 8)$ and $(12, 8)$. Join these points in pairs. Do they lie on a line? What do you observe?
Answer


Take a point $O$ on the graph paper and draw the horizontal and vertical lines $OX$ and $OY$ respectively.
Then, let on the $x$-axis and $y$ axis $1$ cm represents $1$ unit.
In order to plot point $(2,8)$, we start from the origin $O$ and move 8 cm along $O X$. The point we arrive at is $(2,8)$.
To plot point $(7,8)$, we move $7 \ cm$ along $O X$ and 8 cm along $O Y$. The point we arrive at is $(7,8)$.
To plot point $(12,8)$, we move $12 \ cm$ along $O X$ and 8 cm along $O Y$. The point we arrive at is $(12,8)$.
From the graph below, it can be seen that the points lie on a line parallel to $x$-axis because they have the same $y$-coordinate.
View full question & answer