Question
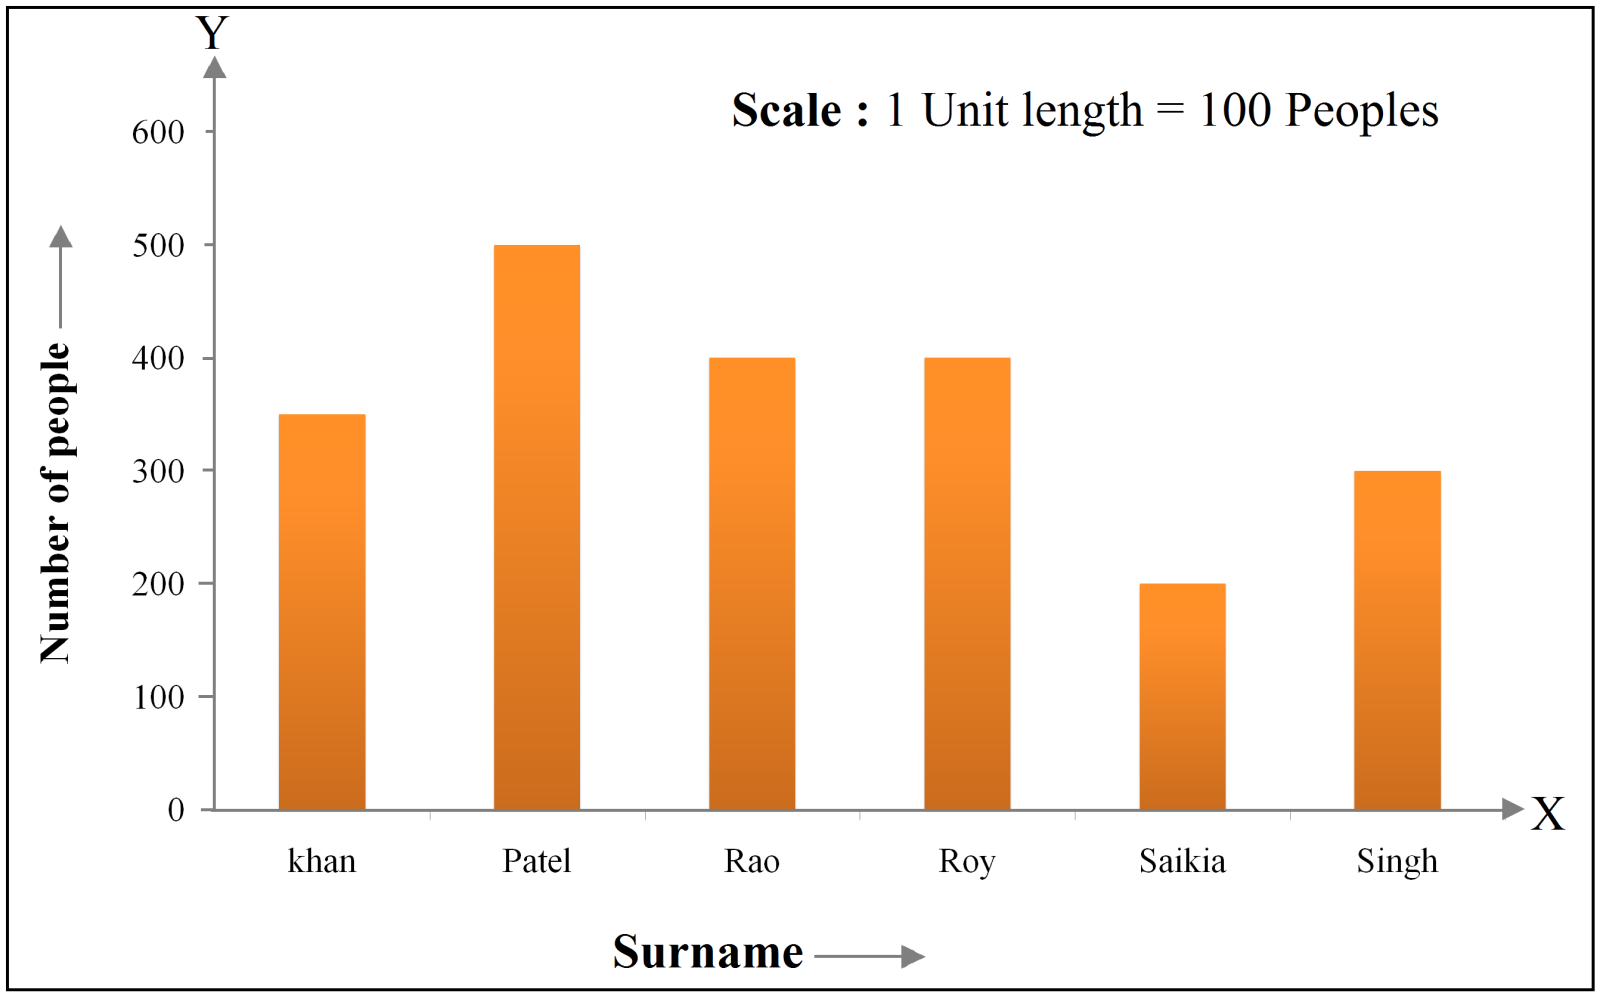
Prepare a bar graph of the data given in question $28.$

Answer

In order to construct a bar graph, first we have to make a table representing the pictograph in tabular form of question $28.$
Surname Number of people
Khan $350$
Patel $500$
Rao $400$
Roy $400$
Saikia $200$
Singh $300$
In order to construct a bar graph representing the above data, we follow the following steps:
Step I: Take a graph paper and draw two mutually perpendicular lines $OX$ and $OY.$ Let $OX$ as the horizontal axis and $OY$ as the vertical axis.
Step II: Along $OX,$ mark surname and along $OY,$ mark number of people.
Step III: Along $OX,$ choose the uniform (equal) width of the bars and the uniform gap between them, according to the space available for the graph.
Step IV: Choose a suitable scale to determine the heights of the bars, according to the availability of space. Here, we choose $1$ unit length represents $100$ people.
Step V: Calculate the height of various bars as follows:
Surname Height of bars
Khan $\frac{350}{100}=3.5\text{ units}$
Patel $\frac{500}{100}=5\text{ units}$
Rao $\frac{400}{100}=4\text{ units}$
Roy $\frac{400}{100}=4\text{ units}$
Saikia $\frac{200}{100}=2\text{ units}$
Singh $\frac{300}{100}=3\text{ units}$
Hence, the required bar graph for the given data is shown below:

Need a full question paper?

Generate a complete, print-ready paper with questions like this in minutes — across 16+ boards, with answer keys.

Start Generating Free

Similar questions

Draw a line $AB$. Take a point $P$ on it. Draw a line passing through $P$ and perpendicular to $AB.$
Draw any angle with vertex $O.$ Take a point $A$ on one of its arms and $B$ on another such that $OA = OB.$ Draw the perpendicular bisectors of $\overline{\text{OA}}$ and $\overline{\text{OB}}$. Let them meet at $P$. Is $PA = PB ?$
By simply looking at the pair of angles given in Fig., state which of the angles in each of the pairs is greater:
Image
Draw number line and locate the points on them: $\frac25,\;\frac35,\frac85,\;\frac45$
In a village six fruit merchants sold the following number of fruit baskets in particular season:

Observe the above pictograph and answer the following questions.
$i.\ $Which merchant sold the maximum number of baskets?
$ii.\ $How many fruit baskets ware sold by answer?
$iii.\ $The merchants who have sold $600$ or more number of baskets are planning to buy a godown for the next season. Can you name them?
Image

Think and mark the positions as directed:
(a) Mark ‘A’ at the point where Akshi will be after she runs 250 m.
(b) Mark ‘B’ at the point where Akshi will be after she runs 500 m.
(c) Now, Akshi ran 1000 m. How many full rounds has she finished running around her track? Mark her position as ‘C’.
(d) Mark ‘X’ at the point where Toshi will be after she runs 250 m.
(e) Mark ‘Y’ at the point where Toshi will be after she runs 500 m.
Given $\overline {AB}$ of length $7.3 \ cm$ and $\overline {CD}$ of length $3.4\ cm,$ construct a line segment $\overline {XY}$ such that the length of $\overline {XY}$ is equal to the difference between the lengths of $\overline {AB}$ and $\overline {CD}$. Verify by measurement.
Arrange the following fractions in descending order:$\frac{2}{3},\frac{3}{15},\frac{7}{10}\ \text{and}\ \frac{8}{15}$
Take three non-collinear points $A, B$ and $C$ on a page of your notebook. Join $AB, BC$ and $CA.$ What figure do you get$?$ Name the triangle. Also, name:
$i.\ $The side opposite to $\angle\text{B.}$
$ii.\ $The angle opposite to side $AB.$
$iii.\ $The vertex opposite to site $BC.$
$iv.\ $The side opposite to vertex $B.$
Draw a line segment $CD.$ Produce it to $CE$ such that $CE = 3CD.$