MCQ
Pressure versus temperature graph of an ideal gas is as shown in figure. Density of the gas at point $A$ is ${\rho _0}$. Density at point $B$ will be
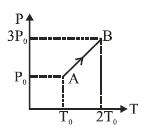
- A$\frac{3}{4}\,{\rho _0}$
- ✓$\frac{3}{2}\,{\rho _0}$
- C$\frac{4}{3}\,{\rho _0}$
- D$2\,{\rho _0}$