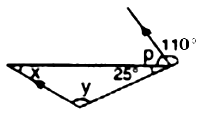
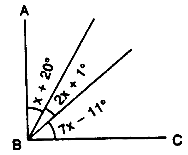
Question
Read the bar graph given below :
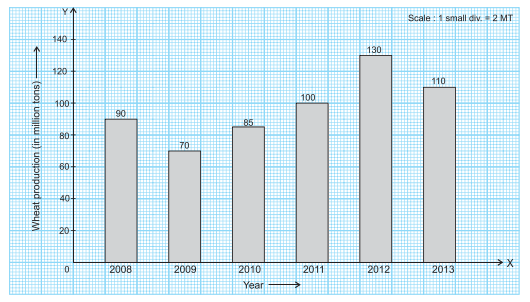
Answer the following questions :
(i) What information is given by the bar graph?
(ii) What was the wheat production in 2010?
(iii) In which year the production was minimum?
(iv) In which year there was maximum increase in production of wheat?
Answer the following questions :
(i) What information is given by the bar graph?
(ii) What was the wheat production in 2010?
(iii) In which year the production was minimum?
(iv) In which year there was maximum increase in production of wheat?