Find the mode of each of the following data : 29, 34, 38, 25, 25, 19, 25, 16, 37, 21, 25
Question types
Data Handling question types
61 questions across 7 question groups — pick any mix to generate a MATHS paper with step-by-step answer keys.
61
Questions
7
Question groups
5
Question types
01
[1 Mark Question Answer]
7 Q→02[2 Mark Question Answer]
6 Q→03[3 marks sum]
5 Q→04[4 marks sum]
18 Q→05TRUE / FALSE
5 Q→06Fill in the blanks.
10 Q→07MCQ
10 Q→Sample Questions
Data Handling questions
One sample from each question group in this chapter. Select any group above to see the full set with answer keys.
View full solution →
Find the mode of each of the following data : 9, 7, 8, 16, 12, 9, 8, 5, 9, 11
The maximum daily temperatures (in ${ }^{\circ} C$ ) of a city during a week are given below :
28.9, 32.6, 24.6, 26.1, 29.2, 30 and 27.4
Find the mean temperature.
View full solution →28.9, 32.6, 24.6, 26.1, 29.2, 30 and 27.4
Find the mean temperature.
The daily wages (in) of 15 workers in a factory are given below :
195, 185, 145, 155, 135, 180, 175, 200, 150, 125, 190, 180, 170, 175, 190
Find the range of the data.
195, 185, 145, 155, 135, 180, 175, 200, 150, 125, 190, 180, 170, 175, 190
Find the range of the data.
The following are the ages (in years) of 12 teachers in a school : 36, 44, 39, 46, 35, 53, 38, 42, 55, 45, 49, 40
Arrange the above data in an ascending order and answer the questions given below : What is the range of the ages of the teachers in the school?
Arrange the above data in an ascending order and answer the questions given below : What is the range of the ages of the teachers in the school?
The marks (out of 50) of 10 students in a class are :
40, 34, 37, 50, 47, 42, 31, 46, 36, 43
Find the median marks.
40, 34, 37, 50, 47, 42, 31, 46, 36, 43
Find the median marks.
The weights of 13 students (in kg) are :48, 41, 52, 65, 40, 53, 34, 61, 47, 42, 44, 31, 35
Find the median weight.
Find the median weight.
A dice was thrown 30 times and the following outcomes were noted :
1, 3, 3, 2, 5, 4, 4, 6, 1, 2, 2, 3, 4, 6, 2, 3, 3, 4, 1, 2, 3, 3, 4, 5, 6, 3, 2, 1, 3, 4
Represent the above data in the form of frequency distribution.
1, 3, 3, 2, 5, 4, 4, 6, 1, 2, 2, 3, 4, 6, 2, 3, 3, 4, 1, 2, 3, 3, 4, 5, 6, 3, 2, 1, 3, 4
Represent the above data in the form of frequency distribution.
The number of children in 25 families are given below :
2, 2, 1, 4, 2, 3, 2, 2, 1, 1, 1, 3, 4, 3, 2, 0, 1, 3, 3, 1, 2, 4, 2, 0, 2
Represent the above data in the form of frequency distribution.
2, 2, 1, 4, 2, 3, 2, 2, 1, 1, 1, 3, 4, 3, 2, 0, 1, 3, 3, 1, 2, 4, 2, 0, 2
Represent the above data in the form of frequency distribution.
The daily wages (in) of 15 workers in a factory are given below :
195, 185, 145, 155, 135, 180, 175, 200, 150, 125, 190, 180, 170, 175, 190
Find the mean daily wage.
195, 185, 145, 155, 135, 180, 175, 200, 150, 125, 190, 180, 170, 175, 190
Find the mean daily wage.
If the mean of 4, 6, x, 9, 10, 5 is 7, find the value of x.
The maximum daily temperatures (in ${ }^{\circ} C$ ) of a city during a week are given below :
28.9, 32.6, 24.6, 26.1, 29.2, 30 and 27.4
Find the range of the data.
View full solution →28.9, 32.6, 24.6, 26.1, 29.2, 30 and 27.4
Find the range of the data.
The following are the ages (in years) of 12 teachers in a school : 36, 44, 39, 46, 35, 53, 38, 42, 55, 45, 49, 40
Arrange the above data in an ascending order and answer the questions given below : What is the mean age of the teachers in the school?
Arrange the above data in an ascending order and answer the questions given below : What is the mean age of the teachers in the school?
The following are the ages (in years) of 12 teachers in a school : 36, 44, 39, 46, 35, 53, 38, 42, 55, 45, 49, 40
Arrange the above data in an ascending order and answer the questions given below : What is the age of the youngest teacher in the school?
Arrange the above data in an ascending order and answer the questions given below : What is the age of the youngest teacher in the school?
In a one-day cricket match, the runs scored by the players of a team are
6, 10, 16, 20, 8, 19, 30, 57, 2, 0, 8.
Find the mean score.
6, 10, 16, 20, 8, 19, 30, 57, 2, 0, 8.
Find the mean score.
In India, the Census is held every 10 years to count the whole population of the country. In a particular Census, the data of the number of children in 25 families of a village was provided as :
1, 2, 4, 2, 0, 2, 3, 3, 1, 0, 2, 3, 4, 3, 1, 1, 2, 1, 2, 3, 2, 4, 1, 2, 2.
Rahul works in the analytics department of the Census. He was given the task of analysing this data of the 25 families of this village.
Q.1. How many families have 3 children?
(a) 2 $\quad$$\quad$(b) 3$\quad$$\quad$ (c) 5$\quad$$\quad$ (d) 6
Q.2. The cumulative frequency of families having 3 children is :
(a) 13$\quad$$\quad$(b) 17$\quad$$\quad$ (c) 18$\quad$$\quad$ (d) 22
Q.3. The mean number of children in these 25 families is :
(a) 1.96 $\quad$$\quad$(b) 2.04$\quad$$\quad$ (c) 2.85$\quad$$\quad$ (d) 3.15
Q.4. The median of the number of children in these 25 families is :
(a) 1 $\quad$$\quad$(b) 2 $\quad$$\quad$(c) 3$\quad$$\quad$ (d) 4
View full solution →1, 2, 4, 2, 0, 2, 3, 3, 1, 0, 2, 3, 4, 3, 1, 1, 2, 1, 2, 3, 2, 4, 1, 2, 2.
Rahul works in the analytics department of the Census. He was given the task of analysing this data of the 25 families of this village.
Q.1. How many families have 3 children?
(a) 2 $\quad$$\quad$(b) 3$\quad$$\quad$ (c) 5$\quad$$\quad$ (d) 6
Q.2. The cumulative frequency of families having 3 children is :
(a) 13$\quad$$\quad$(b) 17$\quad$$\quad$ (c) 18$\quad$$\quad$ (d) 22
Q.3. The mean number of children in these 25 families is :
(a) 1.96 $\quad$$\quad$(b) 2.04$\quad$$\quad$ (c) 2.85$\quad$$\quad$ (d) 3.15
Q.4. The median of the number of children in these 25 families is :
(a) 1 $\quad$$\quad$(b) 2 $\quad$$\quad$(c) 3$\quad$$\quad$ (d) 4
Read the bar graph given below :
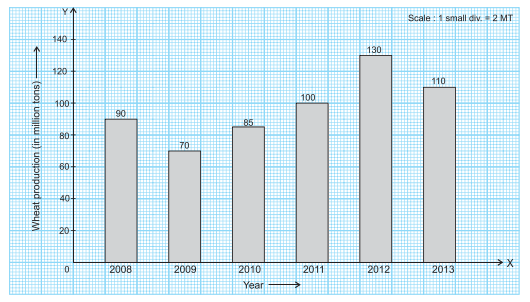
Answer the following questions :
(i) What information is given by the bar graph?
(ii) What was the wheat production in 2010?
(iii) In which year the production was minimum?
(iv) In which year there was maximum increase in production of wheat?
Answer the following questions :
(i) What information is given by the bar graph?
(ii) What was the wheat production in 2010?
(iii) In which year the production was minimum?
(iv) In which year there was maximum increase in production of wheat?
Read the given bar graph and answer the questions that follow :
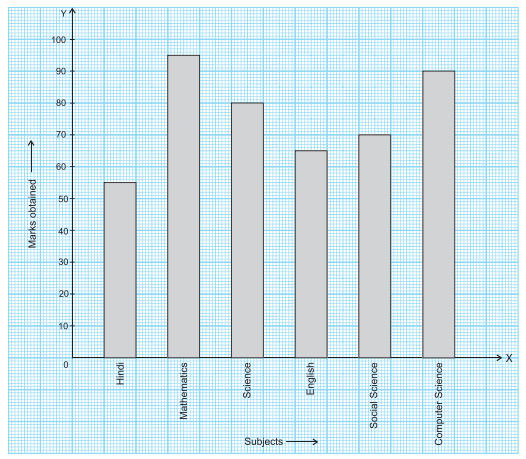
(i) What information is represented by the bar graph?
(ii) How many marks were obtained in English?
(iii) In which subject least marks were obtained?
(iv) What was the total marks obtained in all the subjects together?
(i) What information is represented by the bar graph?
(ii) How many marks were obtained in English?
(iii) In which subject least marks were obtained?
(iv) What was the total marks obtained in all the subjects together?
The air distances of four cities from Delhi (in km) are given below :
Draw a bar graph to represent the above data.
| City | Kolkata | Chennai | Mumbai | Hyderabad |
| Distance from Delhi (in km) | 1340 | 1700 | 1100 | 1220 |
The median of first 10 natural numbers is 5.5.
The observation which occurs most frequently in a data is called the mode.
Mean of first 4 multiples of 2 is 4.
Highest observation - Lowest observation gives the frequency.
Each entry in a raw data is called an observation.
The value of the variable which occurs most frequently is called the __________ of the data.
The arithmetic mean of some observations is equal to the ratio of the sum of the observations to the __________ .
The representation of data in a tabular form showing the frequency of each observation is called __________ .
The number of times a particular observation occurs in a data is called the __________ of the observation.
The difference between the highest and the lowest values of observations in a data is called the __________ of the data.
The median of the first 49 natural numbers is
- A24
- B24.5
- ✓25
- D25.5
Answer: C.
View full solution →The Empirical formula for calculating mode is
- AMode = Mean + Median
- ✓Mode = 3(Median)-2 (Mean)
- CMode = 2(Median)-3 (Mean)
- DMode = Median + 3(Mean)
Answer: B.
View full solution →For n observations arranged in an array, if n is odd, then median is the value of observation.
- A$\left(\frac{n}{2}\right) t h$
- ✓$\left(\frac{n+1}{2}\right) t h$
- C$\left(\frac{n}{2}+1\right) t h$
- D$\left(\frac{n}{2}-1\right) t h$
Answer: B.
View full solution →The mean of $n$ observations $x_1, x_2, \ldots, x_n$ is equal to
- A$n \Sigma x_i$
- B$n \sum x_i{ }^2$
- C$\Sigma x_i$
- ✓$\frac{\Sigma x_i}{n}$
Answer: D.
View full solution →The range of the data given below, is 16, 5, 27, 15, 11, 56, 28, 17, 35, 8, 43
- A5
- B28
- ✓51
- D56
Answer: C.
View full solution →Generate a Data Handling paper free
Pick question groups from the list above, set marks and difficulty, and export a branded PDF with step-by-step answer keys. First 3 chapters free — no signup.