Question
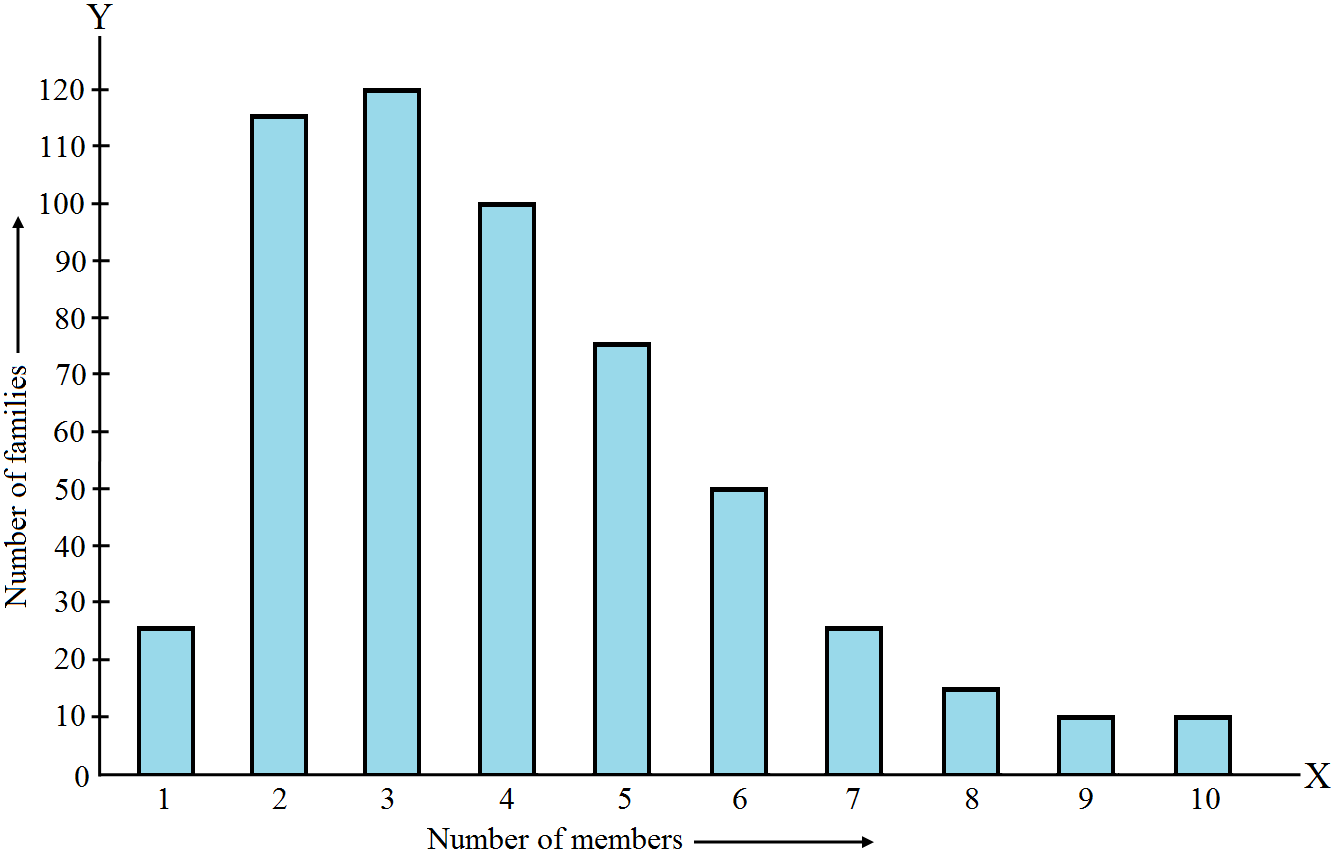
Read the bar graph given in and answer the following questions:
$i.$ What information is given by the bar graph?
$ii.$ What was the crop$-$production of rice in $1970–71?$
$iii.$ What is the difference between the maximum and minimum production of rice?
$i.$ What information is given by the bar graph?
$ii.$ What was the crop$-$production of rice in $1970–71?$
$iii.$ What is the difference between the maximum and minimum production of rice?