Question
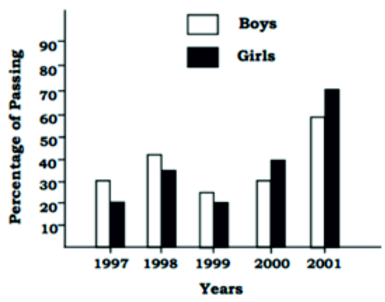
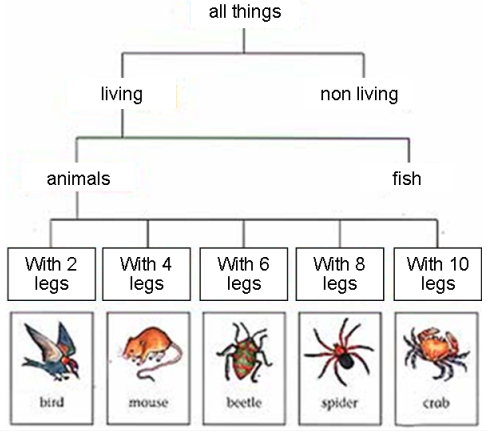
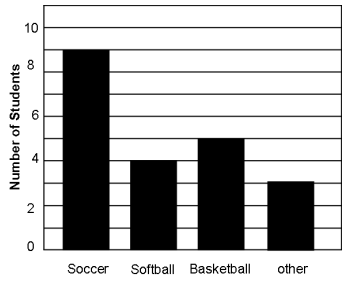
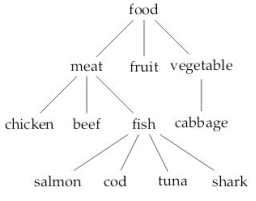
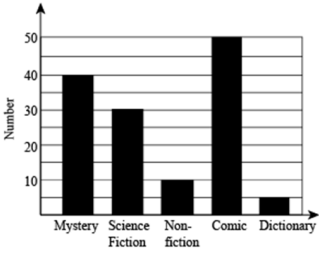
Read the information given in the diagram. Write a paragraph based on it. Give a suitable title to it..

Generate a complete, print-ready paper with questions like this in minutes — across 16+ boards, with answer keys.

| Sports | Cricket | Football | Hockey | Badminton | Swimming | Tennis |
| NO. of Students | 80 | 40 | 20 | 30 | 55 | 75 |