Question
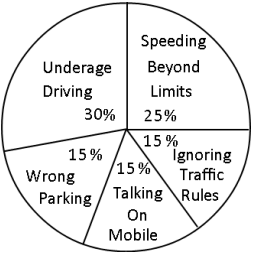
Read the information given in the pie diagram and write a paragraph based on it. Observe the following pie chart and prepare a writeup of about 100 words describing the causes of ‘Increasing Road Accidents’.
Image

Answer

SELF

Need a full question paper?

Generate a complete, print-ready paper with questions like this in minutes — across 16+ boards, with answer keys.

Start Generating Free

Similar questions

Complete the following table given below.
The beautiful city of Simla, a paradise on earth is in Himachal Pradesh. Located among the forests of pine and oak, it is a popular tourist spot. As the name suggests, Himachal Pradesh is located in the scenic Himalayas. The terrain is nearly all mountainous, with deep gorges, snow capped mountains, lush vally and placid lake.Himachal is the home of a variety of flora and fauna. The forest abounds with different types of deers, leopard 
and bears. You may come face to face with the rare musk deer or a snow leopard in a sanctuary or national park of Himachal Pradesh! You can enjoy a yak ride. You will rarely find any flowers and fruits to surpass the one you see in Himachal. Though they are seasonal, their colorful memories are enough to last you through out the year.
No wonder it is a great tourist attraction. The simple hospitable people would always be willing to welcome you. This is the place to go to if you love adventure. Here, you can enjoy trekking, mountaineering, rock climbing, skiing, ice-skating and para-gliding. The year is packed with festivals. Some are cultural, some religious and some are related to sports. The year begins with Lohry or Lohadi festival, when you may witness community dances, bon fires and folk songs. Around the same time, you can visit the national snow statue competition at Kufri. The spirit of joy and celebration continues through out the year.
Simla
 State  .....................
 Animals found .....................
 Adventures .....................
 Forest .....................
 Festivals .....................
Draw a tree diagram to represent the information given in the following passage.
There are many different kinds of musical instruments. They are divided into three main classes according to the way that they are played. For example, some instruments are played by blowing air into them. These are called wind instruments. In some of these the air is made to vibrate inside a wooden tube, and these are said to be of the woodwind family. Examples of woodwind instruments are the flute, the clarinet and the bassoon. Other instruments are made of brass, the trumpet and the horn, for example. There are also various other wind instruments like such as the mouth organ and the bagpipes.
Some instruments are played by banging or striking them. One obvious example is the drum, of which there are various kinds. Instruments like this are called percussion instruments.
The last big group of musical instruments are the ones which have strings. There are two main kinds of stringed instrument those in which the music is made by plucking the strings, and those where the player draws a bow across the strings. Examples of the former are the harp and the guitar. Examples of the latter are the violin and the cello.
Reasons for the failure of students. Show the following information in a pie diagram. Gives the values in percentage as per your own perception.
The failure of the students in the examinations is a very serious matter. There are many reasons for their failure.
The students do not have proper study habits. They read without understanding. They spend their holidays and spare time in watching T.V. They ignore their study for the sake of T.V. films and serials. Parents also do the same. There is no motivation. They cannot improve themselves without motivation. The environment is also very important. Today, lack of proper learning environment also comes in the way of their success. Proper guidance to the students will help to overcome the problem of failure. But there is no proper guidance. 'Low aim is a crime', and this happens with the students today. Students fail to achieve success because of the bad company and wastage of time in playing.
The failure rate can be minimized by proper guidance, motivation, strong will, keeping good company, developing proper study habits and not wasting their time playing games and watching T.V. Prepare a web diagram with the help of the above information.
Read the following paragraph and complete the table by using the information given in the passage. Give a suitable title to it.
Stan Laurel, whose real name was Arthur Jefferson, was born in 1890. He was an English comedian. As a stage actor, in most of his performances, he played such roles which typically exhibited in a combination of dances, music and clowning. He subsequently traveled to America and started appearing in the American films since 1917. Similarly, Oliver Hardy came from Georgia - USA. He was born in the year 1892. He first appeared on stage at the age of only 8. He started film acting in 1914. Both appeared in dozens of silent films before they began their successful partnership in 1927 in a silent comedy, Putting Pants on Philip. In the next thirty years they made talking pictures and achieved great success with films like Sons of the Desert (1934), Way out West (1937) and Blockheads (1938).
PointsStan LaurelOliver Hardy
 Year of birth ................................................
 Profession................................................
 Started acting in film (year)................................................
 Names of their combined films................................................
Exam question
Use the following information to draw a pie diagram. You can allocate your own to the devices as per your preference.
This graph shows the results of a survey in which people aged 16 and over were asked about their preferred devices for accessing the internet. The question referred to going online at home and in other places. Participants mentioned four main devices in their answers: a smartphone, a laptop, a tablet and a desktop computer. The majority of participants prefer to use smartphones and laptops, with just three per cent difference between the two. Nearly a third of participants prefer to go online with a smartphone. Most people like to use a laptop. Desktop computer accounts for office users’ preferred devices. Only a small minority prefer a device other than these main four. In conclusion, since mobile and portable devices are the most popular choices, it is clear that many participants are accessing the internet outside their homes. The desktop computer is the least popular of the four main devices. In future, we can probably expect to see more and more people accessing the internet with smartphones as their preferred choice.
 Top Tips for Writing
i. Start by saying exactly what the pie chart shows. Avoid copying words in the question - use other words with the same or similar meanings.
ii. Mention the Survey question that participants answered. 
iii. Explain what the different sections of the pie chart refer to. 
iv. Describe the key findings shown in the chart.
Prepare a flow chart based on the following information : (March 2008) Modern Olympic Games starts with the
i. Arrival at the stadium of a runner carrying the torch ignited at Olympia in Greece.
ii. Women athlete first competed at the Olympic Games in 1928.
iii. In 1895 a French monk, Father Didon, coined the sporting slogan for the Olympic Motto.
iv. The first meeting in 1896 was held in Athens when 59 athletes from 10 countries competed in a dozen track and field events.
v. The Games are held in different countries in turn, the host being chosen by the International Olympic Committee.
Use the following information to draw a pie diagram.
The students of Saraswati Vidya Mandir uses various modes of transport to school. There are in all 800 students out of which
a. Students, in the school, come to school by bicycle is 45%. They ride the bicycle for around half an hour to reach school. This is the best mode of transport.
b. 15% students walk to school they are usually accompanied by their parents. They use the short cut mode of sky walk where by vehicles are not allowed so even they walk for aroung 40 minutes to reach the bus facility is recently made available fo the students 30% go to school by the bus. It’s the responsibility of the school.an dfinally 10% of the students go to School by their own car they are considered as the finically well off class.
Read the extract given below and represent it’s information in the form of tree-diagram and give a suitable title to it.
      We all love birds, don’t we? Birds can surprise us by their flights. There are many birds with flight but some have lost their ability to fly. The ability to fly is determined by shape, size and height. Griffon Vulture is regarded as the highest flying bird (37,000 feet high) followed by common crane (33,000 feet high).
       The Ostrich, Rhea, Emu and Cassowary cannot fly for various reasons. Though they have lost their ability to fly they can run fast on their long, strong legs. Ostriches live in Africa and are found on the grassy places. The Rhea of South America looks rather like the Ostrich but it is smaller and has three toes on each feet, while the Ostrich has only two.
       Emu is the second-largest bird. Next to its relative, Ostrich. Emu is found in Australia. It can sprint at 50 km/h. Cassowary is largely found in Papua, New Guinea. It is omnivorous and can run at 501 km/ h. It is very interesting to read about our flightless friends. Go, explore more!
Present the information given in the tabular form in the form of tree diagram.
SEX QUALIFICATIONAPPOINTMENT AGE GROUP
MALEFEMALE

POST
GRADUATION

M.PhilPh.DTEMPORARYPERMANENT25-3031-45Above 
45
248522751510622387315077
Read the information given in the diagram. Write a paragraph based on it. Give a suitable title to it.
Image