Maharashtra BoardEnglish MediumSTD 11 ScienceChemistryNuclear Chemistry and Radioactivity4 Marks
Question
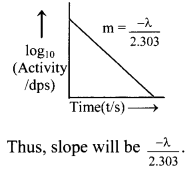
Represent graphically log10 (activity /dps) versus t/s. What is its slope ?
✓
Answer
Equation for a decay constant $(\lambda)$ is given as, $ \lambda=\frac{2.303}{ t } \log _{10} \frac{ N _0}{ N } $ From equation (i), $ \log _{10} N =\frac{-\lambda}{2.303} t +\log _{10} N _0 $ On comparing with $y = m x+ c , y =\log _{10} N , m =\frac{-\lambda}{2.303}, x= t , c =\log _{10} N _0$ Now, $N \propto\left(\frac{- dN }{ dt }\right) \quad$ Hence, instead if $\log _{10} N$ versus t, $\log _{10}\left(\frac{- dN }{ dt }\right)$ which is $\log _{10}$ (activity) is plotted. The graph of $\log _{10}$ (activity/dps) versus t/s gives a straight line which can be represented as follows:
Need a full question paper?
Generate a complete, print-ready paper with questions like this in minutes — across 16+ boards, with answer keys.