Question
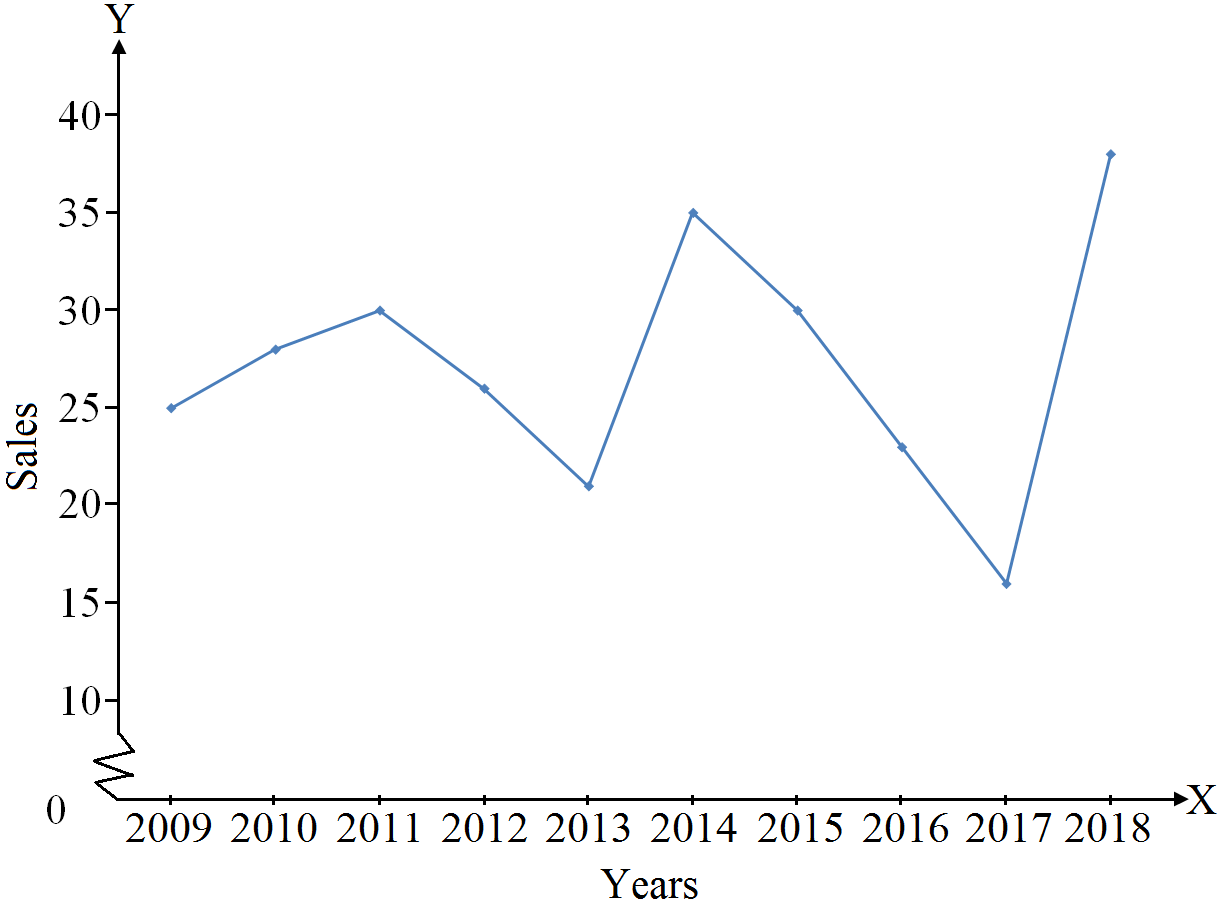
Represent the following data by a graph using false base line:
Years
2009
2010
211
2012
2013
2014
2015
2016
2017
2018
Sales in '000 (₹)
25
28
30
26
21
35
30
23
16
38

Answer

Time Series Graph

Need a full question paper?

Generate a complete, print-ready paper with questions like this in minutes — across 16+ boards, with answer keys.

Start Generating Free

Similar questions

Use pie diagram to represent the following data.
Expenditure item Amount ₹
Salary and Wages 45,000
Rent 15,000
Interest Patment 8,000
Repair 20,000
Capital Formation 12,000
What do you mean by the term supply? Discuss the law of supply with the help of a table and diagram.
With the help of suitable example, explain conversion of an Inclusive Distribution into Exclusive Distribution.
What are the merits and demerits of collecting primary data by telephonic interview? Explain.
Total production of foodgrains of India was 2,500 lakh tonnes during 2015-16. Out of total production, the production of rice, wheat and other crops was 1,000, 900 and 600 lakh tonnes respectively. The percentage contribution of these crops was estimated 40%, 36% and 24%, respectively.
Present this data in tabular form along with its main parts.
Explain by giving examples, how do the following determine price elasticity of demand:
(i) Nature of the good.
(ii) Availability of substitutes.
Draw a Lorenz curve with the help of following data.
Weekly Wages (in ₹) Number of Workers
Factory (A) Factory (B)
6 6 2
25 11 38
60 13 52
84 14 28
105 15 38
150 17 26
170 10 12
400 14 4
The consumer price index for June, $2005$ was $125$. The food index was $120$ and that of other items $135$. What is the percentage of the total weight given to food?
You are given the daily wages paid to workers in two factories $X$ and $Y$.
Wages No. of Workers
Factory X Factory Y
12-13 15 25
13-14 30 40
14-15 44 60
15-16 60 35
16-17 30 12
Using appropriate measures, answer the following:
  1. Which factory pays higher average wages?
  2. Which factory has a more consistent wage structure?
Describe the various types of production costs. Explain the mutual relationship between average cost and marginal cost.