Question
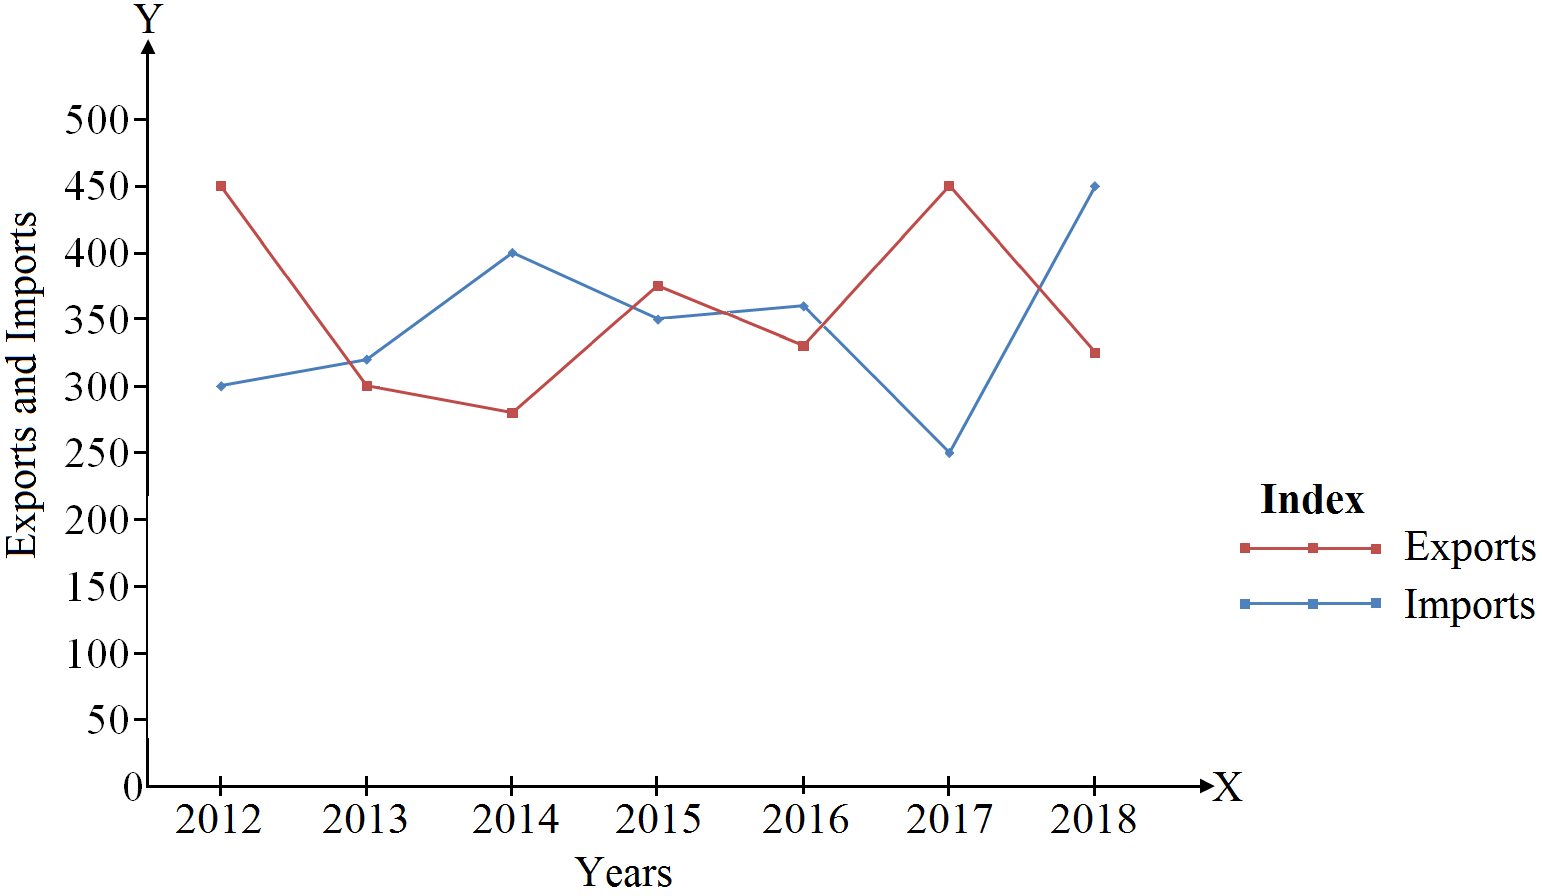
Represent the following information through a time series graph:
Years
2012
2013
2014
2015
2016
2017
2018
Exports (in crores ₹)
300
320
400
350
360
250
450
Imaports (in crores ₹)
450
300
280
375
330
450
325

Answer

Export and Import Graph

Need a full question paper?

Generate a complete, print-ready paper with questions like this in minutes — across 16+ boards, with answer keys.

Start Generating Free

Similar questions

Differentiate between direct personal investigation and indirect oral investigation.
Calculate Coefficient of correlation using step deviation method:
X $30$ $40$ $60$ $70$ $100$
Y $90$ $110$ $140$ $150$ $160$
What are fixed costs? Explain the nature and shape of the total fixed and average fixed cost curves.
Compute Karl Pearson's coefficient of correlation by direct method and interpret the result:
Marks in Mathematics 15 18 21 24 27
Marks in Accountancy 25 25 27 31 32
Read the following hypothetical information carefully and answer the questions 1-6 on the basis of the same:
Output (Units)Total Variable Cost (₹)Average Variable Cost (₹)Marginal Cost (₹)
1202020
2-1612
354-22
48020-
1. At 2nd unit of output produced, total variable cost will be ____________.    (Fill up the blank with correct alternative)
(a) 4
(b) 8
(c) 32
(d) 36

2. At 3rd unit of output produced, average variable cost will be ____________.     (Fill up the blank with correct alternative)
(a) 10
(b) 18
(c) 38
(d) 66

3. Marginal cost is indicated by:            (Choose the correct alternative)
(a) a straight line parallel to X-axis
(b) a straight line parallel to Y-axis
(c) a U-shaped curve
(d) an inverse S-shaped curve

4. Identify the correct formula to calculate Total Cost.            (Choose the correct alternative)
(a) $TC =\frac{ AC }{ Q }$
(b) $TC = TFC + TVC$
(c) $TC = MC _{ n }- MC _{ n -1}$
(d) $TC =\frac{\Delta MC }{\Delta Q }$

5. Read the following statements carefully and choose the correct alternative among those given below:
Statement 1: Total area under MC curve corresponding to any level of output measures TVC for that level of output.
Statement 2: MC curve cuts AC curve at its lowest point.
Alternatives:
(a) Both the statements are true
(b) Both the statements are false
(c) Statement 1 is true and Statement 2 is false
(d) Statement 2 is true and Statement 1 is false

6. At 4th unit of output produced, marginal cost will be ____________. (Fill up the blank with correct alternative)
(a) 2
(b) 20 
(c) 26
(d) 80
Why do we need an index number?
Why will a profit maximising firm in a competitive market never strike its equilibrium in a state when MC is falling? Explain your answer using a suitable diagram.
Consider the following two data sets, where values in set A are the daily sales recorded by an ice-cream vendor; values in set B has the daily sales of a big departmental store :
Set A
500
700
1,000
Set B
10,000
12,000
13,000
  1. Analyse the data by using absolute measures of dispersion and interpret.
  2. Suggest relative counterparts of absolute measures.
Calculate Karl Pearson's coefficient of correlation from following data:
X
24
22
25
27
23
26
Y
18
14
22
20
19
24
Give steps for making frequency polygon.