Question
Solve the following simultaneous equations by graphical method.
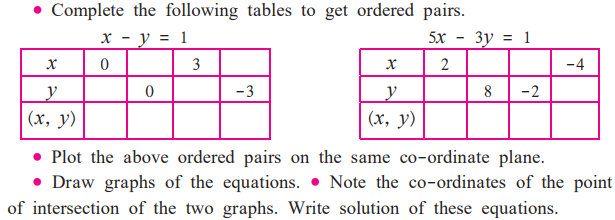
| x | 0 | 1 | 3 | -2 |
| y | -1 | 0 | 2 | -3 |
| (x, y) | (0, -1) | (1, 0) | (3, 2) | (-2, -3) |
| x | 2 | 5 | -1 | -4 |
| y | 3 | 8 | -2 | -7 |
| (x, y) | (2, 3) | (5, 8) | (-1, -2) | (-4, -7) |
Generate a complete, print-ready paper with questions like this in minutes — across 16+ boards, with answer keys.
| Milk Sold (Litre) | $1-2$ | $2-3$ | $3-4$ | $4-5$ | $5-6$ |
| No. of Customers | 17 | 13 | 10 | 7 | 3 |
| No. | Equation | Is the equation a linear equation in 2 variables ? |
| 1 | 4m+3n=12 | Yes |
| 2 | 3x^(2)-7y=13 | |
| 3 | sqrt2x-sqrt5y=16 | |
| 4 | 0x+6y-3=0 | |
| 5 | 0.3 x+0y-36=0 | |
| 6 | (4)/(x)+(5)/(y)=4 | |
| 7 | 4xy-5y-8=0 |
| Time (hrs.) | 0-2 | $2-4$ | $4-6$ | $6-8$ | $8-10$ |
| No. of students | 7 | 18 | 12 | 10 | 3 |
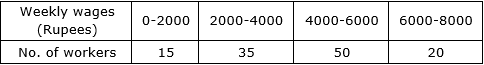
| Weekly wages (Rupees) | 0-2000 | 2000-4000 | 4000-6000 | 6000-8000 |
| No. of workers | 15 | 35 | 50 | 20 |
| Toll | 300-400 | 400-500 | 500-600 | 600-700 | 700-800 |
| No. of drivers | 80 | 110 | 120 | 70 | 40 |

| Production (Thousand rupees) | 25-30 | 30-35 | 35-40 | 40-45 | 45-50 |
| No. of farm owners | 20 | 25 | 15 | 10 | 10 |